
Image
|
Figure Caption
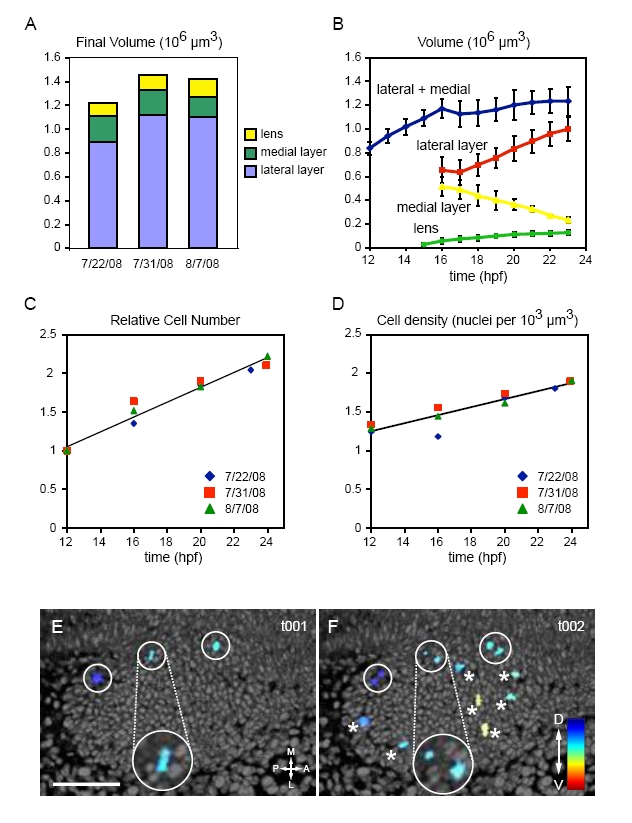
Fig. S1
Quantitation of eye volume, cell count and mitoses. (A) Eye domain absolute volumes (24 hpf) for the three datasets. (B) Absolute volumes of the eye and domains over time. n=3; error bars, s.d. (C) Relative cell count over time (n=3). (D) Cell density over time (n=3). (E,F) Mitosis visualization in 4D datasets. Three-dimensional rendering of nuclei (grayscale) and mitoses (color). (E) Time point t001. Circles, metaphase plates. (F) Time point t002. Circles, daughter nuclei from previous time point; asterisks, new metaphase plates. Dorsal views. Insets show chromatin morphology. Scale bar: 50 μm.
Acknowledgments
This image is the copyrighted work of the attributed author or publisher, and
ZFIN has permission only to display this image to its users.
Additional permissions should be obtained from the applicable author or publisher of the image.
Full text @ Development