
|
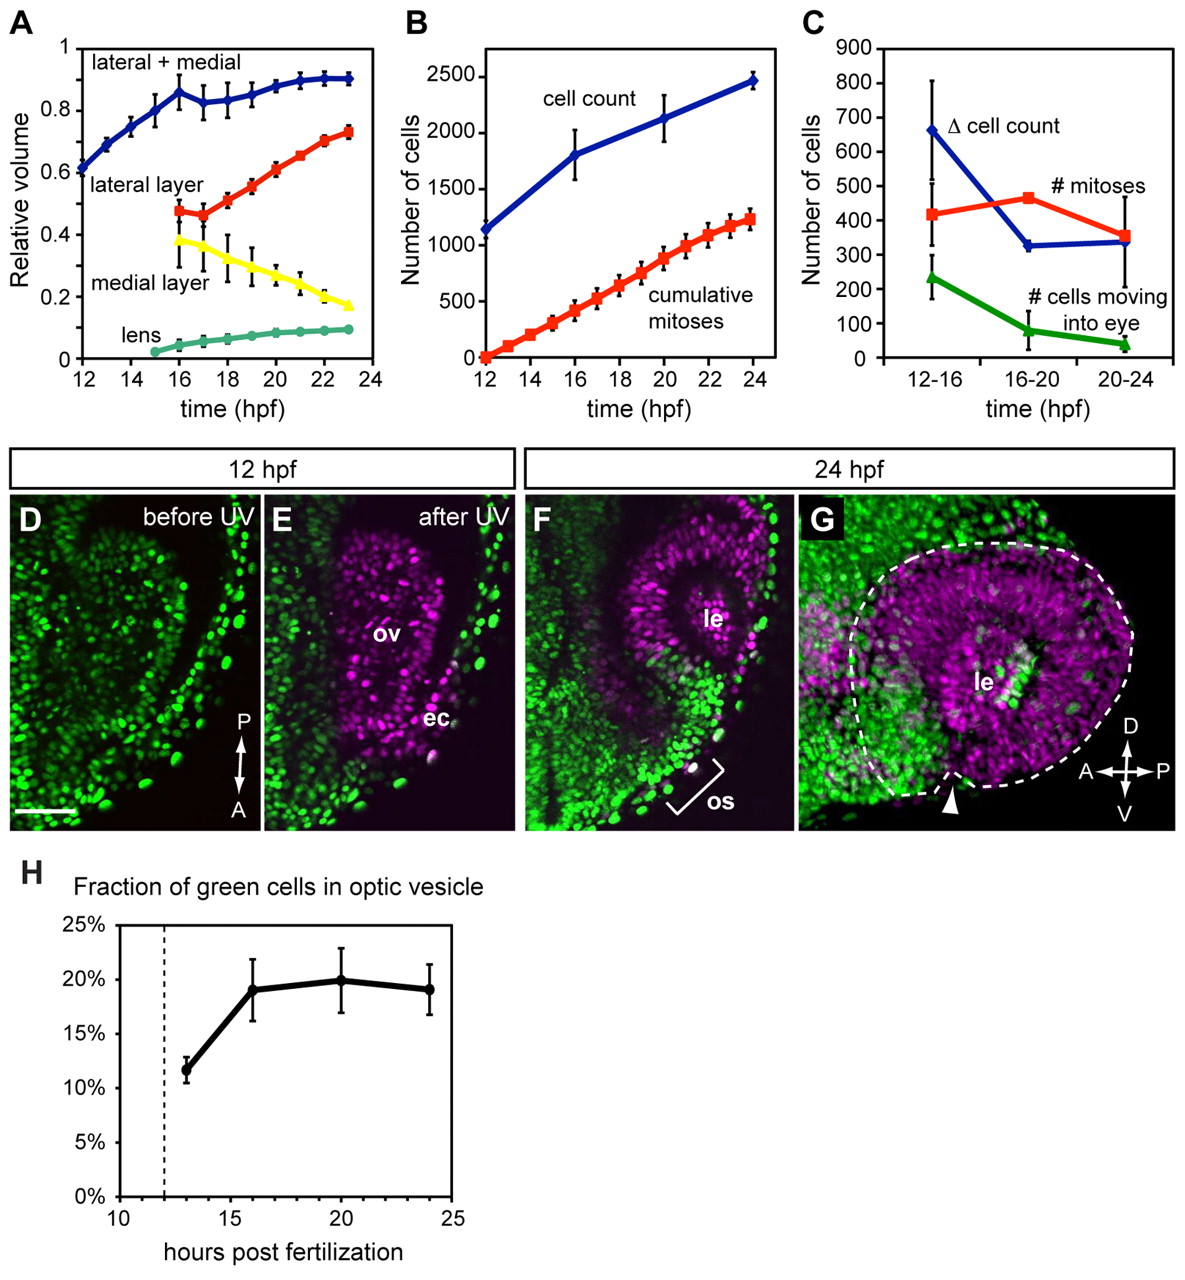
Fig. 2
Quantitative analysis of growth, proliferation and extended evagination during OCM. (A) Relative volume of OV (blue), OV lateral layer (red), OV medial layer (yellow) and lens (green) as a fraction of final volume (OV plus lens). n=3. (B) Cell count (blue) and mitoses (red). n=2. (C) Cell count change (blue), mitoses (red) and number of cells moving into eye (green). n=2 for cell count and mitoses; n=3 for evagination. (D) Single confocal section (dorsal view) of OV at 12 hpf showing nls-Kaede (green) before photoactivation. (E) After photoactivation, the entire OV (and some ectoderm) is converted to red (magenta). (F) Single confocal section (dorsal view) of the same embryo at 24 hpf showing green nuclei in the anterior OC and optic stalk. (G) A 3D-rendered lateral view of same OC. Arrowhead, choroid fissure. The optic cup is outlined. (H) Quantification of extended evagination showing the fraction of green cells within the OV (n=3). Dashed line indicates the time of photoactivation (12 hpf). Only OV cells, not overlying lens/ectoderm, were counted. ec, ectoderm; ov, optic vesicle; os, optic stalk; le, lens. Error bars indicate s.d. Scale bar: 50 μm.