
- Title
-
Exdpf is a key regulator of exocrine pancreas development controlled by retinoic acid and ptf1a in zebrafish
- Authors
- Jiang, Z., Song, J., Qi, F., Xiao, A., An, X., Liu, N.A., Zhu, Z., Zhang, B., and Lin, S.
- Source
- Full text @ PLoS Biol.
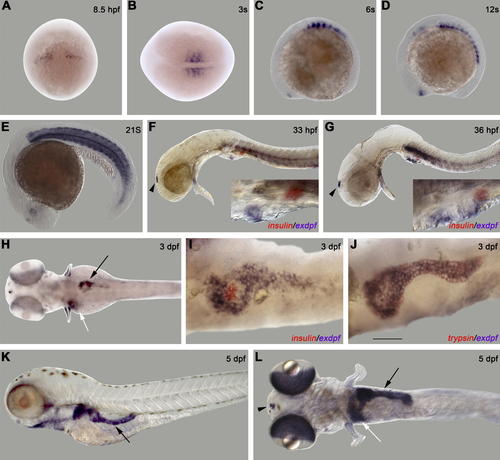
Spatiotemporal Expression of exdpf during Zebrafish Embryogenesis (A–L) In situ hybridization using an exdpf probe or an exdpf probe in combination with an preproinsulin probe (F, G and I) or a trypsin probe (J). (A) 8.5 hpf, dorsal view with anterior on the top. (B) 3-somite, dorsal view with anterior to the left. (C-G) Lateral view with anterior to the left. (C) 6-somite. (D) 12-somite. (E) 21-somite. Note strong expression in muscle area. (F) 33 hpf. (G) 36 hpf. In (F and G): Black arrowhead: epiphysis. Blue: exdpf probe; Red: preproinsulin probe. Inset: enlargement of pancreatic area. (H-J) Dorsal view with anterior to the left. (H) 3 dpf. Black arrow: pancreas. White arrow: liver. (I) 3 dpf. Double in situ hybridization using an exdpf probe (purple) and an preproinsulin probe (red). Note exdpf positive cells encircle preproinsulin-expressing cells; but exdpf is not expressed in those cells. (J) 3 dpf. Double in situ hybridization using an exdpf probe (blue) and a trypsin probe (red). Note that exdpf and trypsin perfectly overlap. (K, L) 5 dpf. (K) Lateral view with anterior to the left. Black arrow: pancreas. (L) Dorsal view with anterior to the left. Black arrow: pancreas. White arrow: liver. Black arrowhead: epiphysis. Scale bar for (I, J): 50 μm. EXPRESSION / LABELING:
|
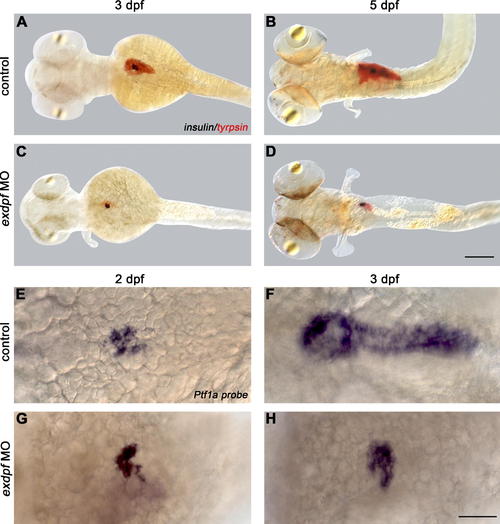
Exdpf Is Required for the Exocrine Pancreas Differentiation and Expansion (A–D) Double in situ hybridization using a trypsin probe (red) and a preproinsulin probe (blue). (A and B) Wild type (WT) embryos. (C and D) Embryos injected with exdpf morpholino. (A) A 3 dpf embryo. Note exocrine pancreas already expanded. (B) A 5 dpf embryo. Note both endocrine and exocrine mass increased. (C) An example of exdpf morphants, 3 dpf. Note exocrine mass is restricted to the anterior area, whereas endocrine portion appears normal. (D) An example of exdpf morphant at 5 dpf. Note exocrine pancreas is still restricted to the anterior area with limited increase in mass. All embryos are mounted in dorsal view, anterior to the left. Scale bar: 100 μm. (E–H) In situ hybridization using a Ptf1a probe. Dorsal view, anterior to the left. (E and F) Wild type embryos at 2 dpf and 3 dpf, respectively. (G and H) Examples of exdpf morphants at 2 dpf and 3 dpf, respectively. Note Ptf1a expression is restricted to the anterior area at 2 dpf (G); the expression is still limited in the anterior area and the mass does not increase at 3 dpf (H). Scale bar: 50 μm. |

Exdpf Restores Expression of the Exocrine Cell Marker in Ptf1a Morphants (A–C) In situ hybridization using a carboxypeptidase A (cpa) probe in 3 dpf embryos. (A) A control embryo injected with water. (B) An embryo injected with 100 pg of exdpf mRNA. Note enhanced expression of cpa. (C) An embryo injected with 2 ng of Ptf1a morpholino. No expression of cpa was detected. (D–F) Embryos injected with 100 pg of exdpf mRNA followed by 2 ng of Ptf1a morpholino. (D) Almost full restoration of cpa expression. (E) No detectable cpa expression in the presumed exocrine area (arrow). (F) Partial restoration of cpa expression. All embryos are shown in lateral view, anterior to the left. Scale bar: 50 μm. (G) Percentage of embryos with cpa expression at 3 dpf. Y-axis represents mean ± SD. EXPRESSION / LABELING:
PHENOTYPE:
|
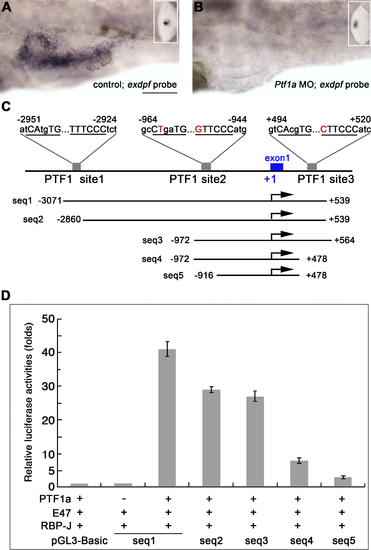
Exdpf Expression Is Regulated by Ptf1a (A and B) In situ hybridization using an exdpf probe in 3 dpf embryos. (A) An embryo injected with standard morpholino control. Inset: epiphysis expression. (B) An embryo inject with Ptf1a morpholino. Inset: epiphysis expression. Note that no exocrine expression of exdpf was detected. All embryos are shown in lateral view, anterior to the left. Scale bar: 50 μm. (C) Locations and sequences of the three potential PTF1 binding sites in zebrafish exdpf gene and different exdpf promoter segments used in luciferase assay. The E-box and TC-box are underlined and capital letters indicate conserved nucleotides. The nucleotides that are not confirmed to the conserved nucleotides are in red. Dots indicate the spaces between the E-box and TC-box. (D) Comparison of the activities of the segments containing different Ptf1 binding sites when transfected into 293 cells. These segments were inserted just before the ORF of luciferase gene. Luciferase reporter activity was adjusted for transfection efficiency and expressed relative to the promoterless pGL3-Basic vector. Error bars represent standard deviations. EXPRESSION / LABELING:
PHENOTYPE:
|
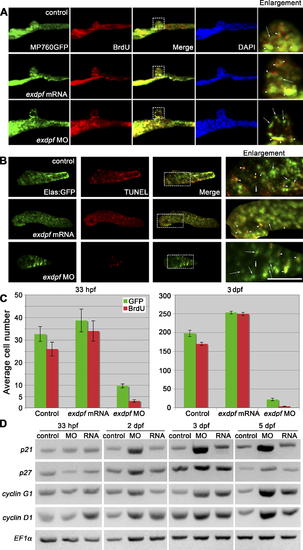
Reduced exdpf Causes Defects of Exocrine Cell Proliferation (A) BrdU labeling result in 33 hpf embryos. Green: MP760:GFP, Red: BrdU staining. Blue: DAPI staining. Dorsal view, anterior to the left. Enlargement represents higher magnification of boxed area in each row. Arrows indicate non-proliferating cells; arrowheads indicate proliferating cells as evidenced by overlapping of red and green colors. (B) BrdU labeling result in 3 dpf embryos. Green: elastase A:GFP, Red: BrdU staining. Lateral view, anterior to the left. Scale bar: 50 μm. Arrows indicate non-proliferating cells; arrowheads indicate proliferating cells as evidenced by overlapping of red and green colors. (C) Quantitative graphs for BrdU incorporation rate in 33 hpf or 3 dpf embryos. The average number of GFP positive cells with BrdU incorporation was obtained by counting BrdU-labeled GFP positive cells from five embryos. Y axis: Mean ± SD. (D) Semiquantitative RT-PCR examination of expression of cyclin D1 and cell cycle inhibitors p21, p27 and cyclin G1 in control (control), exdpf morphants (MO), and exdpf mRNA injected embryos (RNA) at 33 hpf, 2 dpf, 3 dpf, and 5 dpf. In each group, 30 embryos were used to extract total RNA for RT-PCR. EXPRESSION / LABELING:
PHENOTYPE:
|
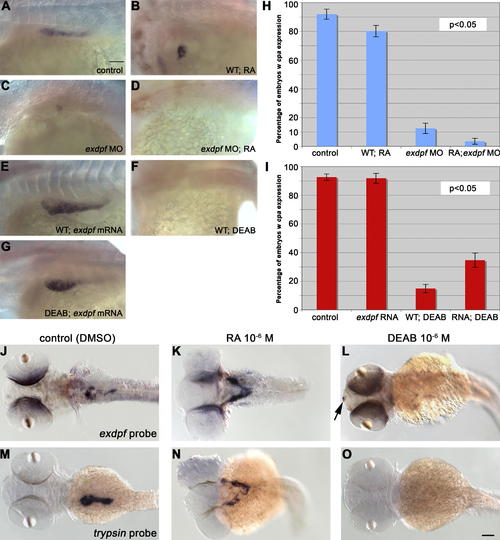
The exdpf Gene Acts Genetically Downstream of RA during Exocrine Pancreas Development (A–G) In situ hybridization on 3 dpf embryos using a carboxypeptidase A (cpa) probe. (A) A WT control embryo. Note posterior expansion of exocrine pancreas. (B) An example of WT embryo treated with 10-6 M RA. Note exocrine pancreas is restricted to the anterior part in the endogenous position. (C) An example of WT embryo injected with 2 ng of exdpf morpholino. Note exocrine pancreas is restricted to the head area in a similar fashion to (B). (D) An example of WT embryo injected with 2 ng of exdpf morpholino followed by treatment of 10-6 M RA. Note no cpa expression was detected. (E) A WT embryo injected with 100 pg of exdpf mRNA. Note the increase of exocrine pancreas. (F) A WT embryo treated with 10-6 M of DEAB. No cpa expression was detected. (G) An example of WT embryo injected with 100 pg of exdpf mRNA followed by treatment with 10-6 M of DEAB. Note cpa expression was detected but not fully expanded posteriorly. All embryos were mounted anterior to the left, dorsal-lateral view. Scale bar: 50 μm. (H) A quantitative graph showing the percentage of embryos with cpa expression corresponding to (A–D). Y-axis, percentage of embryos with cpa expression. Mean ± SD. (I) A quantitative graph showing the percentage of embryos with cpa expression corresponding to (E–G) and control (A). Y-axis, percentage of embryos with cpa expression. Mean ± SD. In (H, I), percentage numbers are obtained from three independent experiments (n = 3). P value is from two-tail t-test for two samples assuming unequal variance (experimental group versus control). (J–O) In situ hybridization results using an exdpf or trypsin probe. (J and M) WT embryos treated with DMSO as controls. (K and N) WT embryos treated with 10-6 M of RA. Note no exdpf or trypsin expression posterior to the white arrows. (L and O) WT embryos treated with 10-6 M of DEAB. EXPRESSION / LABELING:
PHENOTYPE:
|
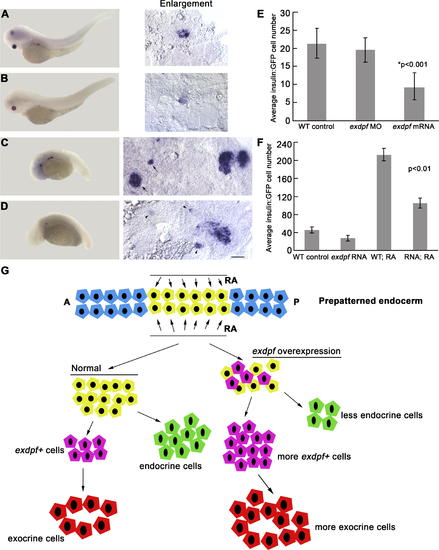
Overexpression of exdpf Represses Endocrine Cell Differentiation in Both WT and RA-Treated embryos (A–D) In situ hybridization on 3 dpf embryos using a preproinsulin probe. Enlargement: higher magnification of pancreatic area. (A) A WT embryo treated with DMSO as control. (B) A WT embryo injected with 100 pg of exdpf mRNA. (C) A WT embryo treated with 10-6 M of RA. Note anterior expansion of endocrine cells at the endogenous position and anterior ectopic endocrine cells (arrows). (D) A WT embryo injected with 100 pg of exdpf mRNA followed by RA treatment. Note weak anterior ectopic endocrine cells (arrowheads). Scale bar: 50 μm. (E) A quantitative graph showing average GFP-positive cells per preproinsulin:GFP embryo at 24 hpf. Y axis, Mean ± SD. (F) A quantitative graph showing average GFP-positive cells per preproinsulin:GFP embryo at 3 dpf. Y axis, Mean ± SD. (G) A model for the effect of exdpf on endocrine cell differentiation. Normally, exdpf is only expressed in the exocrine cell precursors after endocrine cell differentiation. Injection of exdpf mRNA caused ectopic expression of exdpf in the committed pancreatic progenitors before endocrine cell differentiation. Therefore, more progenitors are transformed into exocrine cell fate and fewer progenitors develop into endocrine cells. EXPRESSION / LABELING:
|
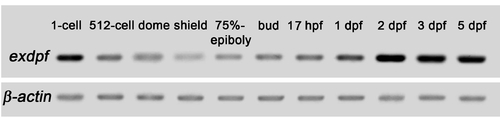
RT-PCR Result of exdpf During Embryogenesis Note exdpf can be detected at one-cell stage, indicating that the transcripts are maternally deposited into the eggs. Zygotic expression of exdpf starts at around shield stage and increases during subsequent embryogenesis. A strong level of exdpf expression can be detected at 2 dpf and lasts until 5 dpf, the longest time point of this analysis. |
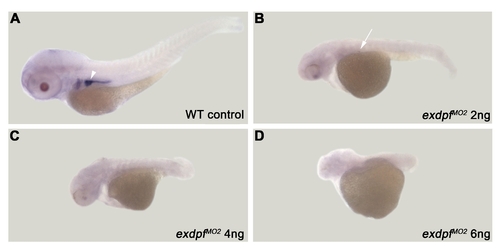
Exdpf Antisense Morpholino Oligonucleotide MO2 Inhibits Exocrine Pancreas Formation (A and B) In situ hybridization using a carboxypeptidase A (cpa) probe. (A) A wild-type (WT) embryo injected with 2 ng of standard morpholino oligonucleotide control. White arrow head: cpa expression in pancreas. (B) An embryo injected with 2 ng of exdpf MO2. Note severely reduced expression of cpa (white arrow). (C) An embryo injected with 4 ng of exdpf MO2. (D) An embryo injected with 6 ng of exdpf MO2. |
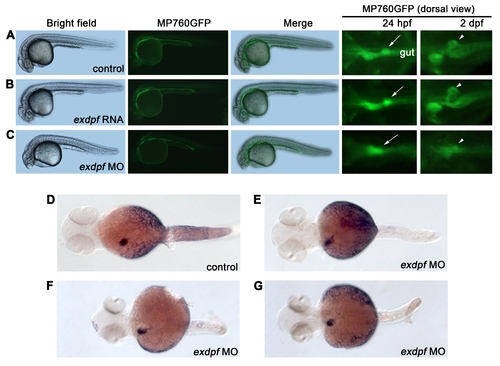
Exdpf is Specifically Required for Exocrine Pancreas Formation but not Gut or Liver (A–C) Expression of GFP MP760GFP transgenic fish. (A) A control embryo injected with standard control morpholino. Note strong GFP expression in the pancreatic area at 24 hpf (arrow) and 2 dpf (arrowhead). (B) An example of embryo injected with exdpf mRNA (100 pg). Note strong GFP expression in the pancreatic area at 24 hpf (arrow) and 2 dpf (arrowhead). GFP expression in the developing gut is comparable to that in control embryo. (C) An example of embryo injected with exdpf morpholino (2ng of MO1exdpf). Note no strong GFP expression in the presumed pancreatic area at 24 hpf (arrow). A weak GFP positive pancreatic bud can be observed at 2 dpf (arrowhead). GFP expression in the gut is still comparable to that in the control and exdpf RNA injected embryos. (D–G) In situ hybridization using a ceruloplasmin probe with 3 dpf embryos. (D) A control embryo injected with standard morpholino control. (E–G) Examples of embryos injected with exdpf morpholino. Note comparable expression of cerulaplasmin in all embryos. |
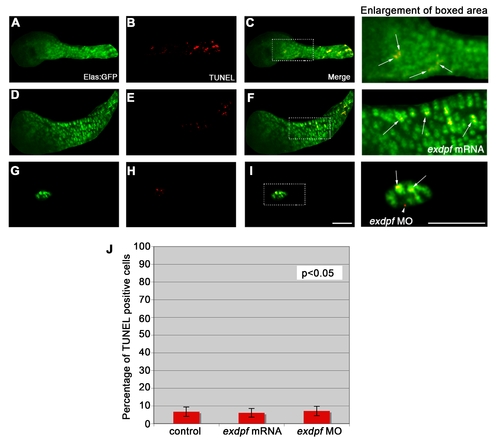
Reduced exdpf Does not Affect Apoptosis in the Developing Pancreas (TUNEL assay result in 5 dpf embryos. (A–C) A control embryo injected with standard morpholino control. Enlargement: of boxed area in (C). Note a few cell debris representing cells undergoing apoptosis (arrows in C enlargement). (D–F) An embryo injected with 100 pg of exdpf mRNA. Enlargement: of boxed area in (F). Note comparable number of cells undergoing apoptosis (arrows). (G–I) An embryo injected with exdpf morpholino. Enlargement: of boxed area in (I). Note both exocrine cells (arrows) and non-exocrine cells (arrowhead) undergoing apoptosis. Lateral view, anterior to the left. Scale bar: 50 μm. (J) A quantitative graph of TUNEL assay. |
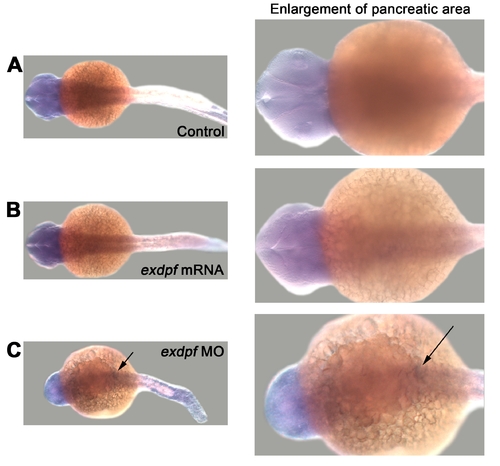
Reduced exdpf Specifically Increases p21 Expression in the Pancreatic Area In situ hybridization using a p21 probe. (A) A control embryo injected with standard morpholino control. Note p21 expression in the head area. No p21 expression is detected in the pancreatic area. (B) An embryo injected with exdpf mRNA (100 pg). Note p21 expression in the head area. No p21 expression is detected in the pancreatic area. (C) An embryo injected with exdpf morpholino. Note p21 expression in the pancreatic area (arrow). |
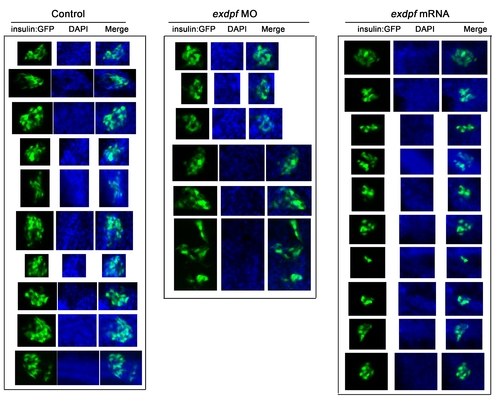
Examples of preproinsulin:GFP Embryos Used for Cell Counting Green: preproinsulin:GFP. Blue: DAPI staining. All embryos are at 24 hpf, de-yolked and flat mounted. |