
Fig. 6
- ID
- ZDB-IMAGE-090106-17
- Genes
- Publication
- Jiang et al., 2008 - Exdpf is a key regulator of exocrine pancreas development controlled by retinoic acid and ptf1a in zebrafish
- All Figures
- Figures for Jiang et al., 2008
|
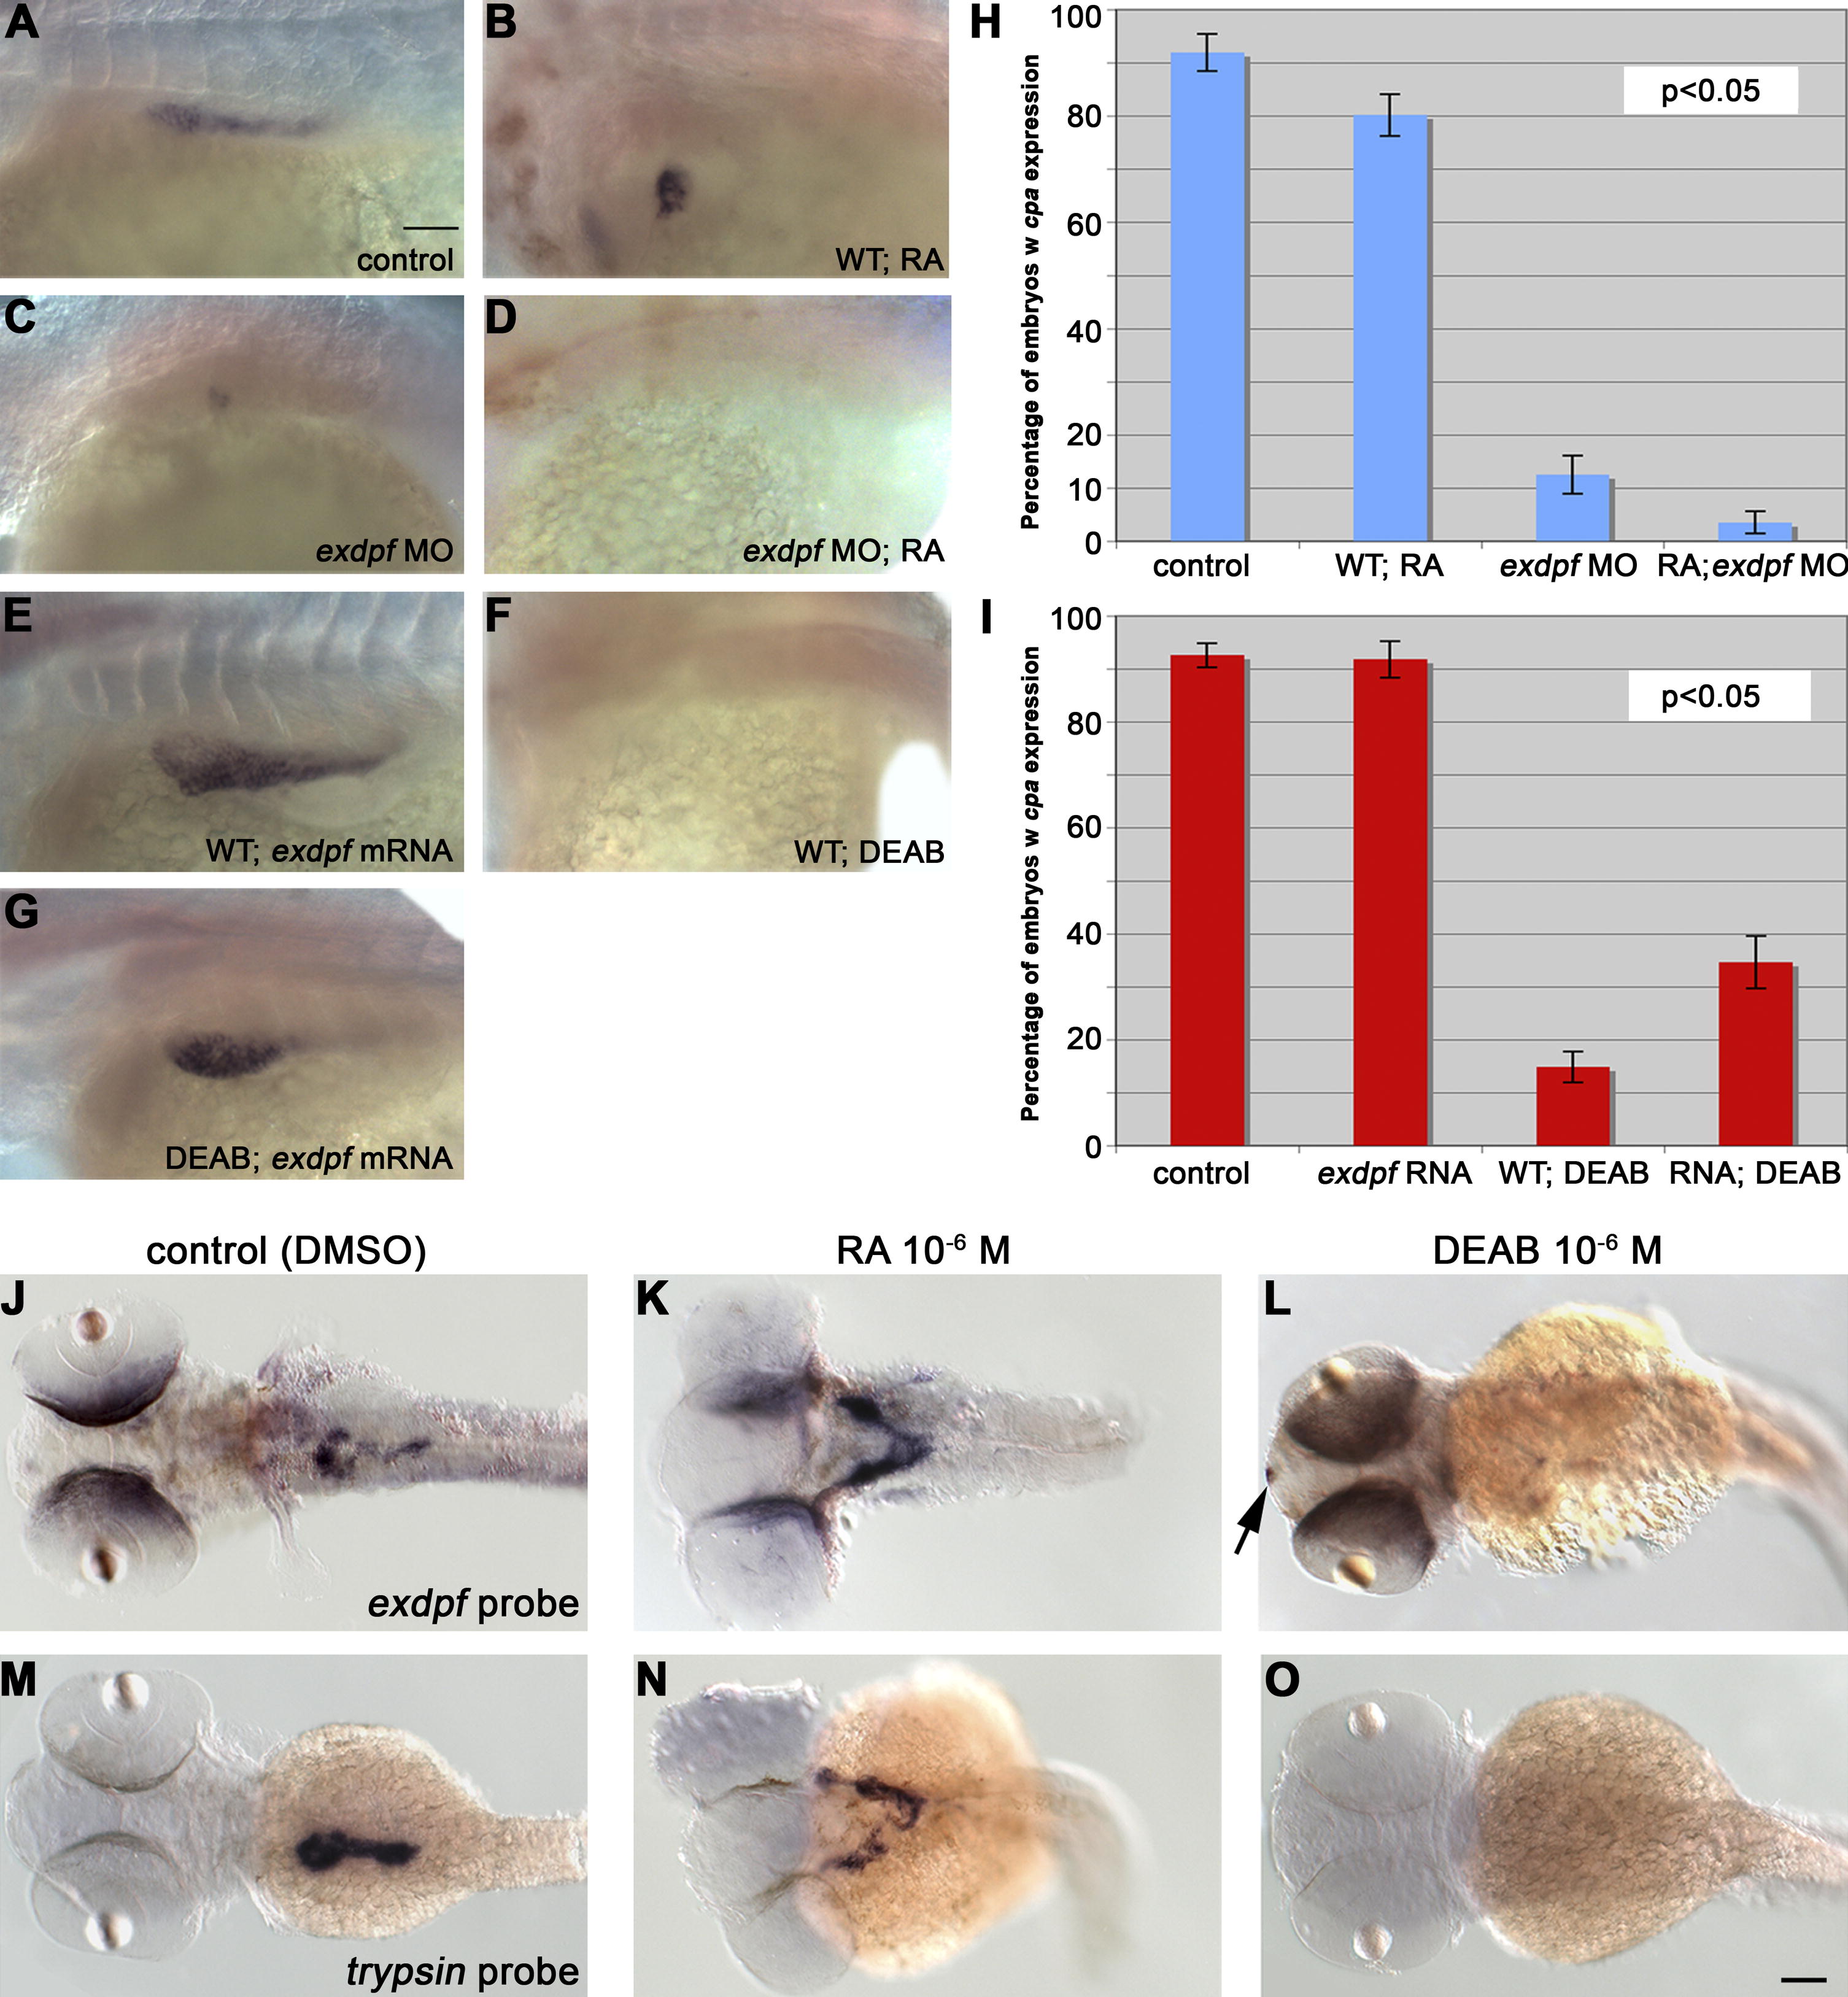
Fig. 6 The exdpf Gene Acts Genetically Downstream of RA during Exocrine Pancreas Development
(A–G) In situ hybridization on 3 dpf embryos using a carboxypeptidase A (cpa) probe. (A) A WT control embryo. Note posterior expansion of exocrine pancreas. (B) An example of WT embryo treated with 10-6 M RA. Note exocrine pancreas is restricted to the anterior part in the endogenous position. (C) An example of WT embryo injected with 2 ng of exdpf morpholino. Note exocrine pancreas is restricted to the head area in a similar fashion to (B). (D) An example of WT embryo injected with 2 ng of exdpf morpholino followed by treatment of 10-6 M RA. Note no cpa expression was detected. (E) A WT embryo injected with 100 pg of exdpf mRNA. Note the increase of exocrine pancreas. (F) A WT embryo treated with 10-6 M of DEAB. No cpa expression was detected. (G) An example of WT embryo injected with 100 pg of exdpf mRNA followed by treatment with 10-6 M of DEAB. Note cpa expression was detected but not fully expanded posteriorly. All embryos were mounted anterior to the left, dorsal-lateral view. Scale bar: 50 μm.
(H) A quantitative graph showing the percentage of embryos with cpa expression corresponding to (A–D). Y-axis, percentage of embryos with cpa expression. Mean ± SD.
(I) A quantitative graph showing the percentage of embryos with cpa expression corresponding to (E–G) and control (A). Y-axis, percentage of embryos with cpa expression. Mean ± SD. In (H, I), percentage numbers are obtained from three independent experiments (n = 3). P value is from two-tail t-test for two samples assuming unequal variance (experimental group versus control).
(J–O) In situ hybridization results using an exdpf or trypsin probe. (J and M) WT embryos treated with DMSO as controls. (K and N) WT embryos treated with 10-6 M of RA. Note no exdpf or trypsin expression posterior to the white arrows. (L and O) WT embryos treated with 10-6 M of DEAB.