
Fig. 1
- ID
- ZDB-IMAGE-090106-12
- Genes
- Publication
- Jiang et al., 2008 - Exdpf is a key regulator of exocrine pancreas development controlled by retinoic acid and ptf1a in zebrafish
- All Figures
- Figures for Jiang et al., 2008
|
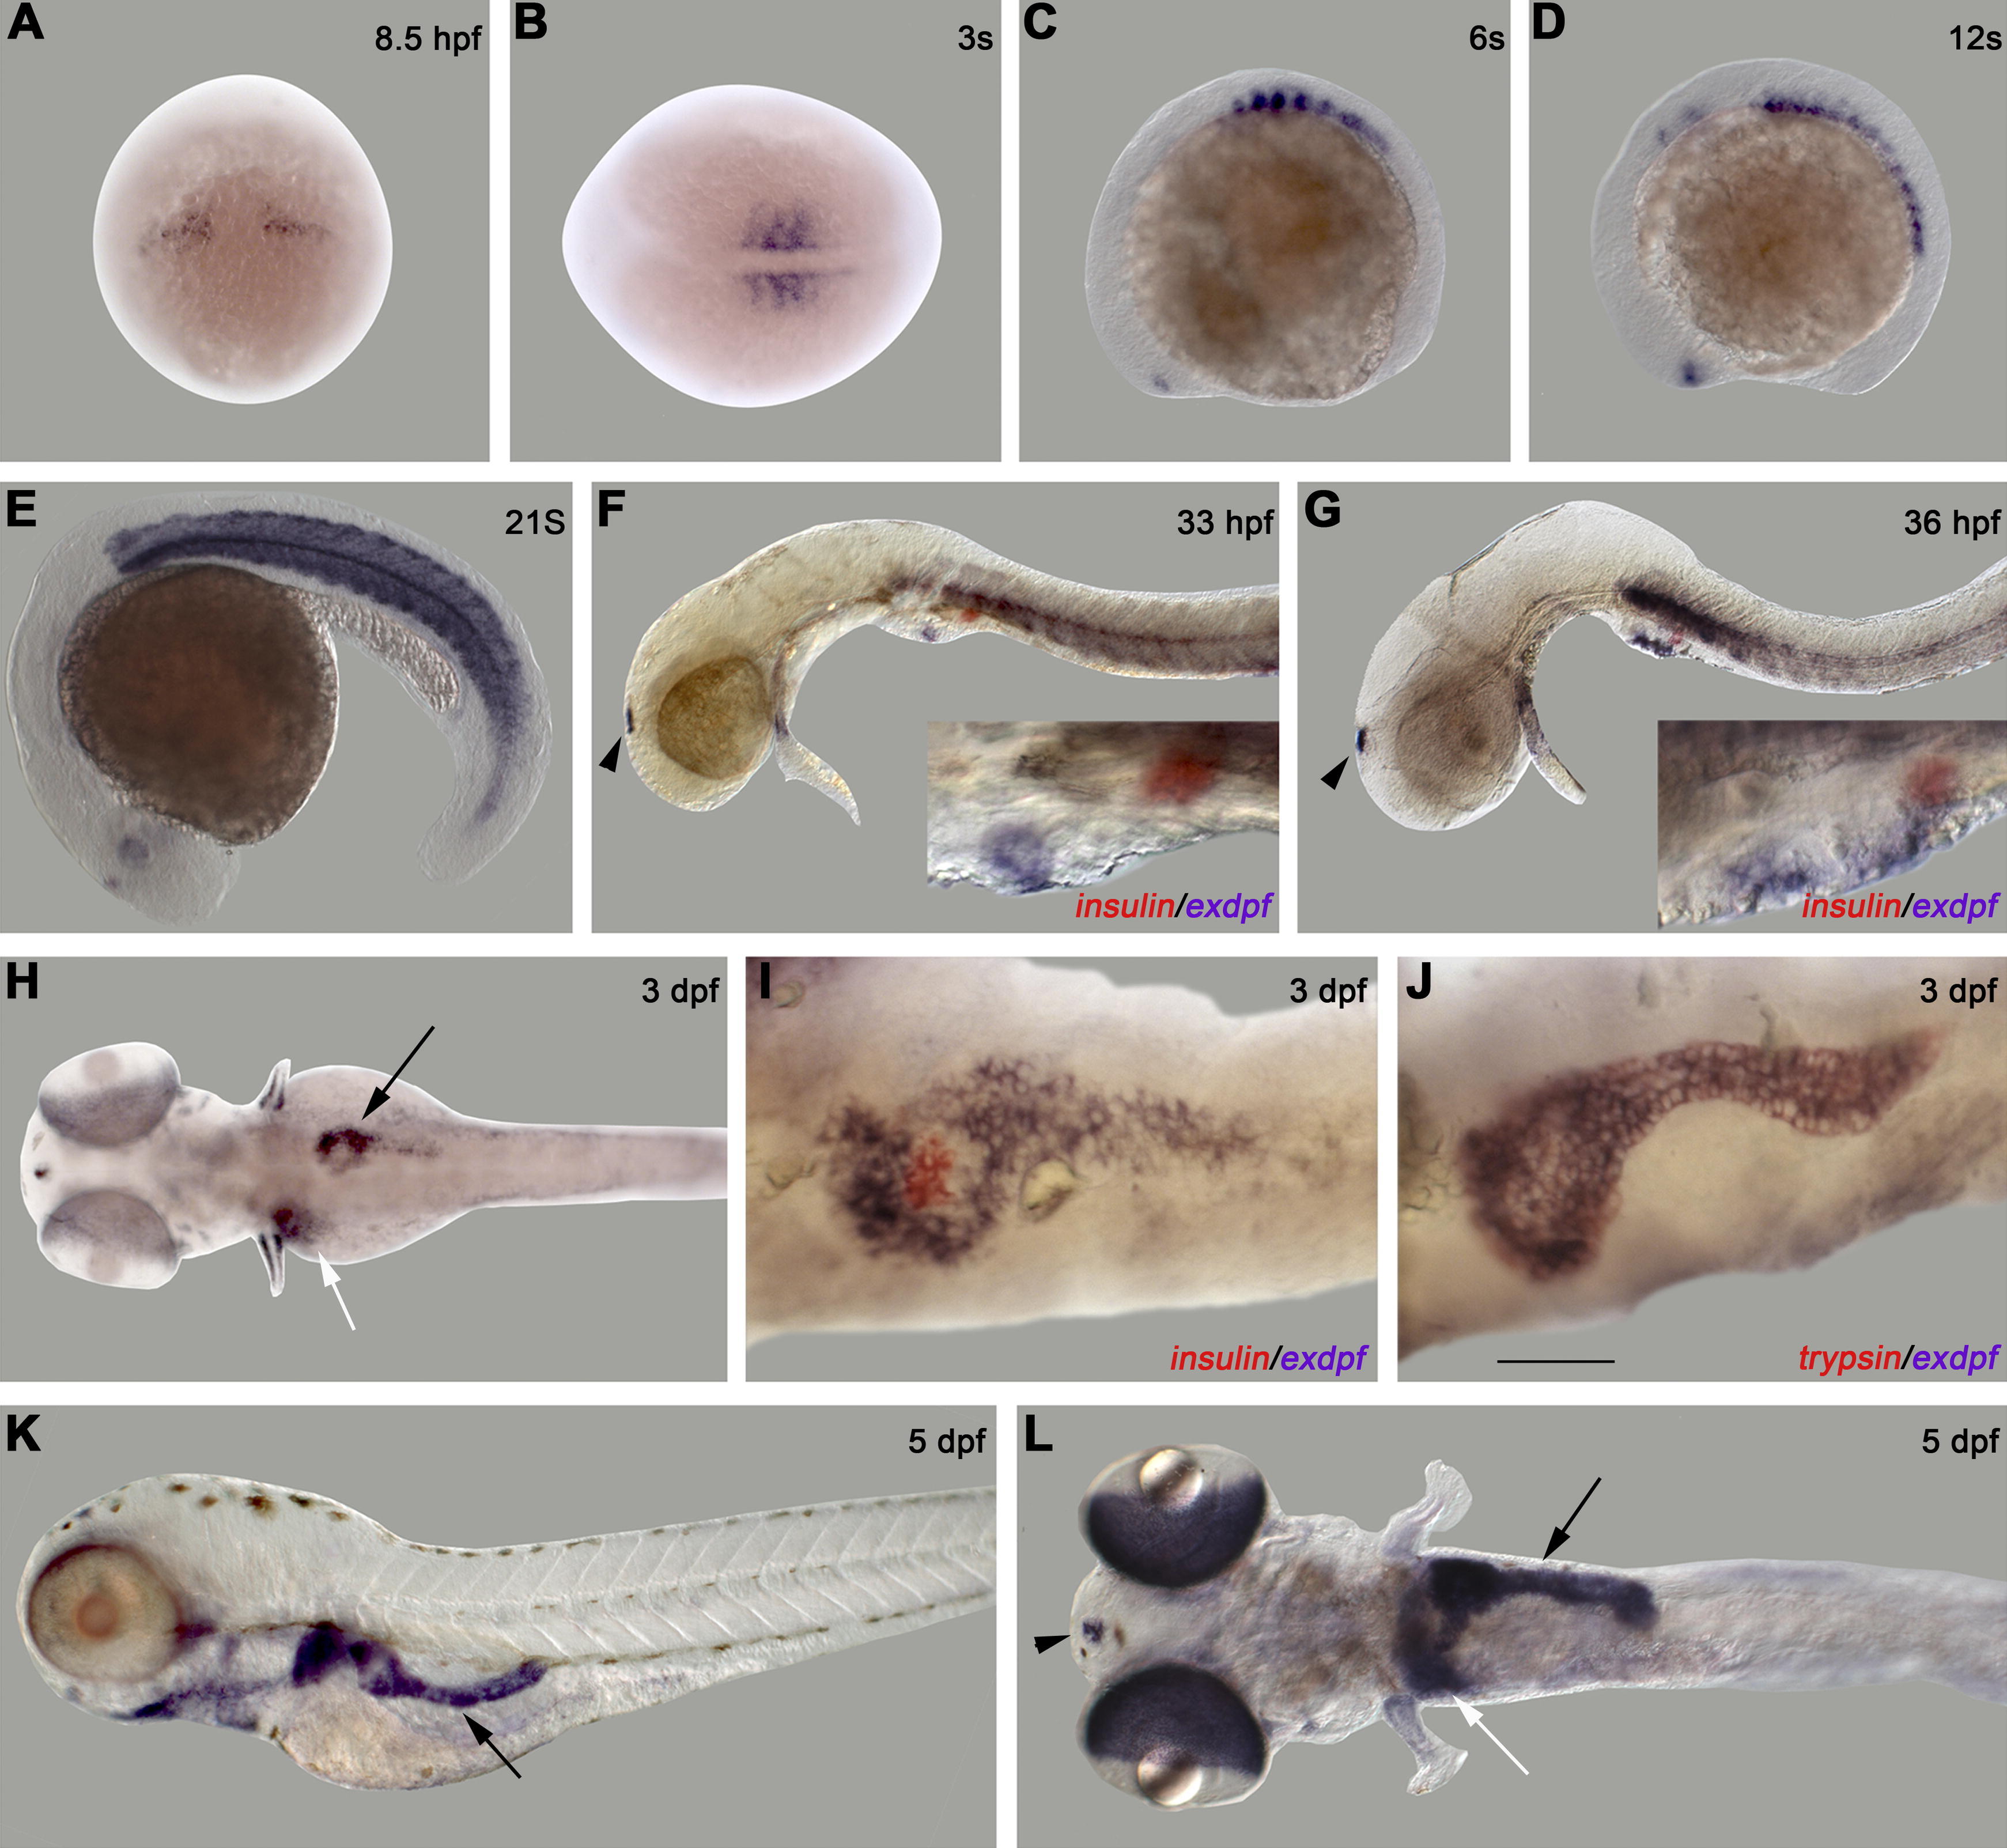
Fig. 1 Spatiotemporal Expression of exdpf during Zebrafish Embryogenesis
(A–L) In situ hybridization using an exdpf probe or an exdpf probe in combination with an preproinsulin probe (F, G and I) or a trypsin probe (J). (A) 8.5 hpf, dorsal view with anterior on the top. (B) 3-somite, dorsal view with anterior to the left. (C-G) Lateral view with anterior to the left. (C) 6-somite. (D) 12-somite. (E) 21-somite. Note strong expression in muscle area. (F) 33 hpf. (G) 36 hpf. In (F and G): Black arrowhead: epiphysis. Blue: exdpf probe; Red: preproinsulin probe. Inset: enlargement of pancreatic area. (H-J) Dorsal view with anterior to the left. (H) 3 dpf. Black arrow: pancreas. White arrow: liver. (I) 3 dpf. Double in situ hybridization using an exdpf probe (purple) and an preproinsulin probe (red). Note exdpf positive cells encircle preproinsulin-expressing cells; but exdpf is not expressed in those cells. (J) 3 dpf. Double in situ hybridization using an exdpf probe (blue) and a trypsin probe (red). Note that exdpf and trypsin perfectly overlap. (K, L) 5 dpf. (K) Lateral view with anterior to the left. Black arrow: pancreas. (L) Dorsal view with anterior to the left. Black arrow: pancreas. White arrow: liver. Black arrowhead: epiphysis. Scale bar for (I, J): 50 μm.