
Fig. 1
- ID
- ZDB-IMAGE-070918-30
- Genes
-
- a1cf
- acaa1
- adh8a
- agt
- ahcy
- ahsg1
- aldob
- ambp
- apoa2
- apoba
- apoc1
- apoc2
- apom
- bckdhbl
- bhmt
- c8a
- c8gl
- c9
- cbln10
- cfb
- chrna5
- cp
- cpn1
- cyp2aa6
- cyp2ad2
- cyp2x12
- cyp24a1
- dhrs9
- dio2
- dync1li1
- esr1
- esr2b
- f2
- fabp10a
- fads2
- fbp1b
- fetub
- fga
- fgg
- fn1b
- foxa3
- fxyd3
- gatm
- gchfr
- gdal
- gpt
- gstp1.2
- hnf4a
- hpda
- hpxa
- igfbp2a
- itih2
- itih3b.2
- kng1
- ldhbb
- lipca
- lpla
- mat1a
- med12
- mpx
- msmbl
- mst1
- mycla
- nots
- nupr1b
- olfm1b
- pklr
- plg
- pnp4b
- proca
- rbp4
- rcn3
- rpl5a
- rps6
- sat2a.2
- scp2a
- sdr16c5b
- serpina1l
- serpina7
- serpinc1
- serpind1
- serpinf2a
- serping1
- sid4
- slc1a3a
- slc38a4
- sox4a
- tfa
- tgfbi
- tprb
- tpt1
- uox
- vcanb
- vtg2
- vtnb
- wu:fb58h05
- wu:fc26d05
- wu:fd55c06
- wu:fi15h08
- zar1
- zgc:123103
- zgc:153921
- Source
- Figures for Cheng et al., 2006
|
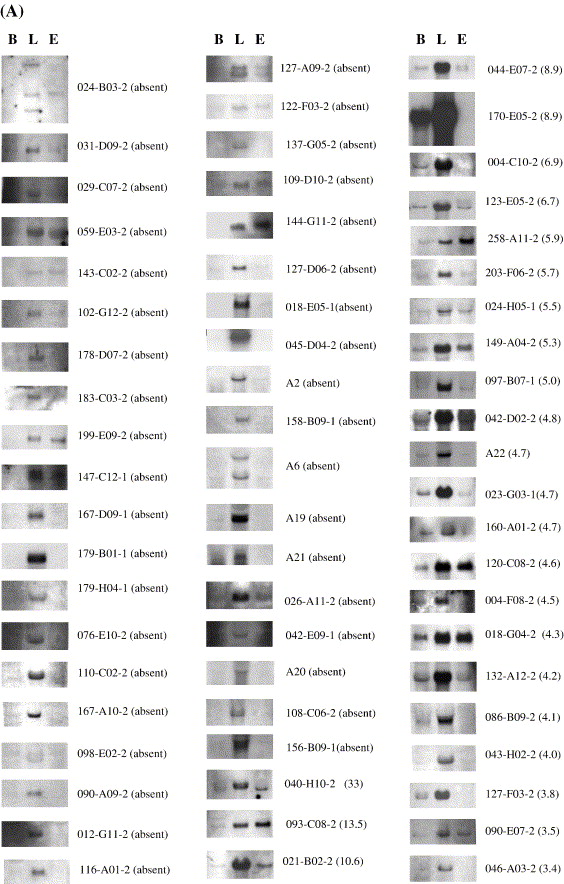
Fig. 1 Classification of liver-enriched genes in zebrafish. RNA samples were extracted from the dissected liver and liver-free body, respectively. In panel A, RNA samples from 3 dpf embryos were also included. Probes were derived from EST clones or gene fragments cloned in plasmid vector via RT-PCR using gene-specific primers (Table 1; Supplementary Table 4). RNA hybridization blots were arranged according to the descending ratio of expression levels of liver vs. liver-free body (as indicated in the bracket). We arbitrarily grouped this set of genes according to the ratio of expression level. Genes with ratios more than 6.9 are considered as liver-specific genes, ratios between 6.9 and 2 as highly-liver-enriched genes and ratios less than 2 as moderately-liver-enriched genes. Clone identification is shown on the right side. Hybridization intensity was quantified using software Molecular Analyst (Bio-rad). B, liver-free body; L, liver; E, 3 dpf embryos.
Reprinted from Developmental Biology, 294(2), Cheng, W., Guo, L., Zhang, Z., Soo, H.M., Wen, C., Wu, W., and Peng, J., HNF factors form a network to regulate liver-enriched genes in zebrafish, 482-496, Copyright (2006) with permission from Elsevier. Full text @ Dev. Biol.