
Fig. S4
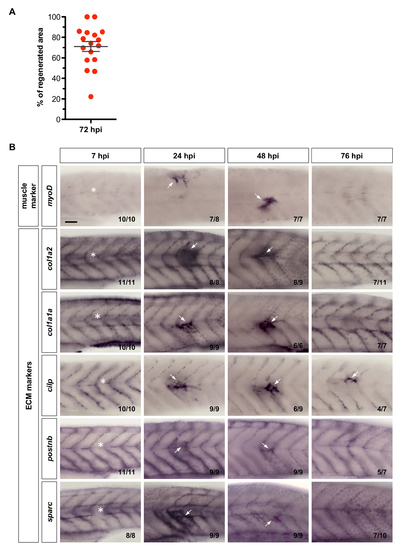
ECM molecules are upregulated during muscle regeneration. (A) Quantification of col1a2+ MPC contribution to muscle regeneration in col1a2NTR-mCherry; α- actin:GFP embryos at 72 hpi. The corresponding experiment is shown in Figure 4A. The percentage of contribution was calculated by dividing the area of mCherry+ muscle fibers at the injury site by the total regenerated area marked by slightly elevated α-actin:GFP expression. Data are plotted with mean ± SEM indicated. n = 17 embryos. (B) Wild-type embryos were needle stabbed to injure a somite near the end of yolk extension (asterisks) at 3dpf, and fixed at 7, 24, 48, and 76 hpi. Embryos were then stained with the myogenic marker (myoD) and ECM markers (col1a2, col1a1a, cilp, postnb, and sparc). All markers showed upregulation at the site of injury starting from 24 hpi (arrows). Representative images are shown with the n number indicated for each staining. Scale bar: 50 μm. |