
Fig. 2
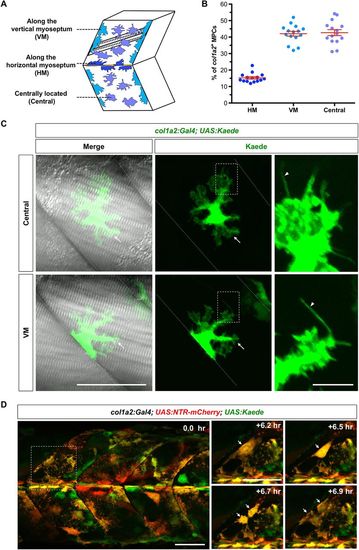
Characterization of col1a2+ MPCs. (A) Schematics of col1a2+ MPC distribution. (B) Quantification of col1a2+ MPC distribution at 2 dpf. n=15 embryos. (C) Mosaic col1a2Kaede embryos were selected to image single col1a2+ MPCs. Examples of centrally located MPCs (top panel) and MPCs along the VM (bottom panel) are shown. col1a2+ MPCs display ramified morphology with lamellipodia-like structures (arrows) and fine filopodia-like protrusions (arrowheads in expanded views). (D) col1a2:Gal4; UAS:NTR-mCherry; UAS:Kaede embryos were imaged at 2 dpf for 7.9 h. Stills from Movie 2 show the division of a col1a2+ MPC (arrows). Scale bars: 50 µm (C,D) and 20 µm (expanded views in D). |