
Fig. 4
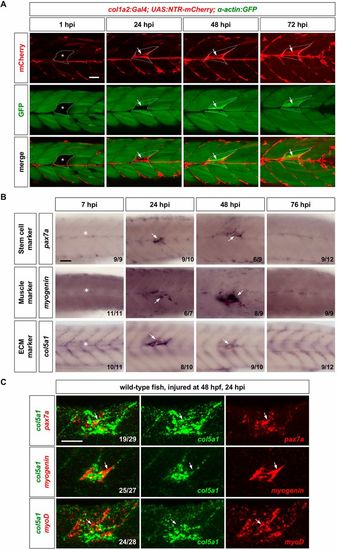
ECM dynamics during muscle regeneration. (A) col1a2NTR-mCherry; α-actin:GFP embryos were needle injured at 3 dpf, and imaged at 1, 24, 48 and 72 hpi. Injured muscles (asterisks) can be identified by the lack of α-actin:GFP expression (green) at 1 hpi, whereas regenerated muscles are marked by slightly elevated α-actin:GFP expression. mCherry+ cells (arrows) emerged at the site of injury at 24 hpi, and generated new mCherry+ myofibers by 72 hpi. Dotted lines outline the injured/regenerated regions. n=17 embryos. (B) Wild-type embryos were needle stabbed to injure muscles near the end of yolk extension (asterisks) at 3 dpf and stained for several markers (pax7a, myogenin and col5a1) at different time points. (C) Muscles of wild-type embryos were injured by needle stabbing at 48 hpf and double stained at 24 hpi using the col5a1 probe (green) with either pax7a, myogenin or myoD probes (red, arrows). Representative images are shown with the n number indicated for each staining in B and C. Scale bars: 50 µm. |