
Fig. 1
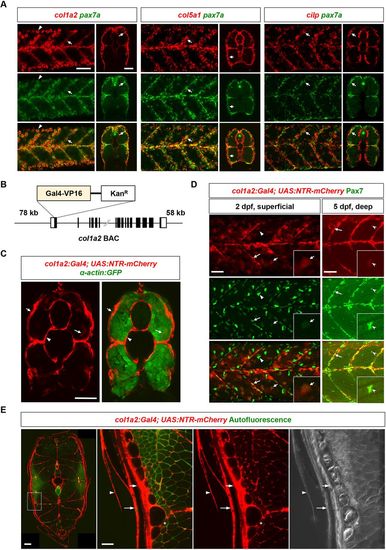
The dermomyotome is marked by the expression of ECM genes. (A) Double fluorescent in situhybridization shows the co-expression of ECM genes col1a2, col5a1 and cilp (red) with the MPC marker pax7a (green) in the dermomyotome (arrows) at 3 dpf. Both lateral and transverse views are shown. Note that the high level of col1a2 expression in the epidermis bleeds into the green channel (arrowheads). n=13 embryos per staining. (B) Schematics of the col1a2:Gal4 BAC reporter. (C) col1a2NTR-mCherry; α-actin:GFP fish at 3 dpf shows mCherry expression (red) in the dermomyotome (short arrows) on the surface of muscles, labeled by α-actin:GFP (green), cells around the notochord (arrowheads) and occasionally myofibers (long arrows). n=16 embryos. (D) col1a2NTR-mCherry fish (red) were co-stained with the anti-Pax7 antibody (green). At 2 dpf, a superficial plane shows that most mCherry+ cells are co-labeled with Pax7 (n=20 embryos). Note that Pax7 also labels mCherry− xanthophores (bean-shaped nuclei with stronger Pax7 staining, arrowheads). At 5 dpf, a deeper plane shows that some Pax7+ fiber-associated MPCs are weakly mCherry+ (n=37 embryos). Insets show magnified views of double positive MPCs. Long arrows: MPCs along the vertical myoseptum; short arrows: centrally located MPCs; notched arrowheads: fiber-associated MPCs. (E) Stitched confocal tile scans show transverse views of col1a2NTR-mCherry fish at 22 mm SL. Expanded views of the boxed region are shown on the right. mCherry expression (red) can be observed in the presumptive dermomyotome (short arrows), the skin (long arrows), scales (arrowheads) and occasionally muscles (asterisks). The autofluorescence signal (green) is shown to highlight the outline of myofibers. n=6 fish. Scale bars: 50 µm (A,C,D,E) and 200 µm (left panel in E). |
| Genes: | |
|---|---|
| Fish: | |
| Anatomical Terms: | |
| Stage Range: | Long-pec to Adult |