
Fig. 6
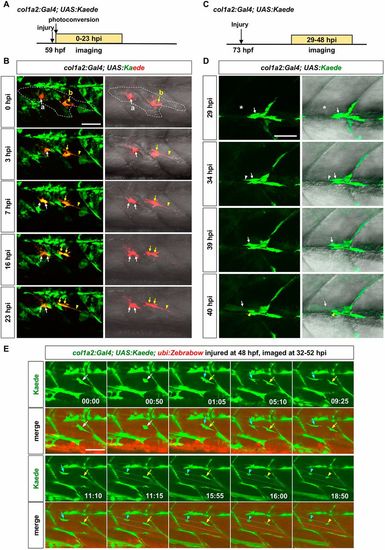
In vivo dynamics of col1a2+ MPCs during muscle regeneration. (A) Experimental design. col1a2Kaede embryos were needle injured, photoconverted at 59 hpf, and imaged at 0-23 hpi. (B) Still images from Movie 3 show the dynamics of 2 Kaedered cells. Both cells were within the muscle injury area (outlined by dashed lines). Cell labeled ‘a’ (white arrows) maintained the ramified morphology, and divided once at 7 hpi generating two daughter cells with similar morphologies. By contrast, cell ‘b’ (yellow arrows) extended to form an elongated morphology (arrowheads), and divided once at 16 hpi generating two polarized daughter cells. n=6 embryos. (C) Experimental design. Mosaic col1a2Kaede embryos were injured at 73 hpf, and imaged at 29-48 hpi. (D) Stills from Movie 4 show that a Kaede+ MPC (arrows) near the injury site (asterisks) elongated at 34 hpi (white arrowheads), formed protrusions at 39 hpi, and fused with a neighboring myofiber at 40 hpi. The new myofiber can be visualized by the weak Kaede expression throughout the muscle cytoplasm and the strong Kaede signal in the nucleus (yellow arrowheads). n=13 fusion events from 9 embryos. (E) col1a2Kaede; ubi:Zebrabow embryos were injured at 48 hpf and imaged at 32-52 hpi. Stills from Movie 6 are shown with time stamps (hh:mm) indicated. A Kaede+ MPC (white arrows) divided between 00:50 and 01:05. The anterior daughter (cyan arrows) fused with a myofiber (dotted lines) between 11:10 and 11:15, while the posterior daughter (yellow arrows) fused with the same myofiber between 15:55 and 16:00. Concentrated Kaede expression in the nucleus after the cell fusion was clearly visible (arrowheads of corresponding colors). n=31 fusion events from 12 embryos, of which 3 pairs of sibling cells sequentially fused with the same myofiber, as shown in E. Scale bars: 50 µm. |