
Fig. 11
- ID
- ZDB-FIG-160217-15
- Publication
- Yokota et al., 2015 - Endothelial Ca(2+) oscillations reflect VEGFR signaling-regulated angiogenic capacity in vivo
- Other Figures
- All Figure Page
- Back to All Figure Page
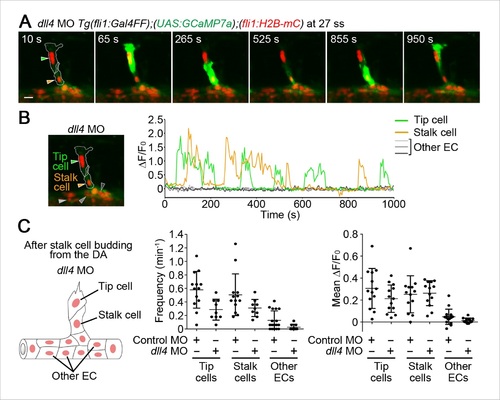
Dll4 does not regulate Ca2+ oscillations in stalk cells after they completely migrate out of the DA. (A) 3D-rendered time-sequential images of Tg(fli1:Gal4FF);(UAS:GCaMP7a);(fli1:H2B-mC) embryos after stalk cell budding from the DA injected with dll4 MO (27 ss). Green and orange arrowheads indicate tip and stalk cells, respectively. (B) The fluorescence changes in GCaMP7a (ΔF/F0) of individual ECs from A indicated by arrowheads at the left panel are shown as a graph. (C) Ca2+ oscillation frequency (left) and mean ΔF/F0 (right) in tip cells, stalk cells, and other ECs within the DA in control MO- or dll4 MO-injected embryos after stalk cell budding from the DA as illustrated at the left panel. (n ≥ 9). Scale bar, 10 mm in A. |
| Genes: | |
|---|---|
| Fish: | |
| Knockdown Reagent: | |
| Anatomical Terms: | |
| Stage Range: | 26+ somites to Prim-5 |