
Fig. 9
- ID
- ZDB-FIG-160215-26
- Publication
- Yokota et al., 2015 - Endothelial Ca(2+) oscillations reflect VEGFR signaling-regulated angiogenic capacity in vivo
- Other Figures
- All Figure Page
- Back to All Figure Page
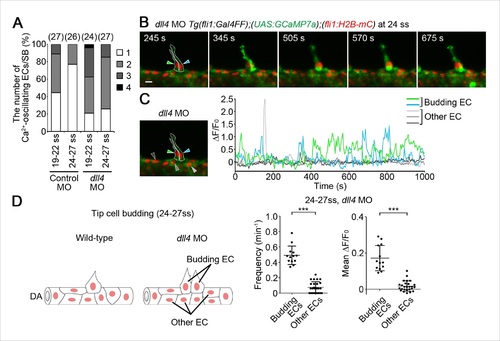
Dll4 is involved in suppressing Ca2+ responses in ECs adjacent to tip cells. (A) The number of Ca2+-oscillating ECs at each somite boundary of the embryo injected with control MO or dll4 MO was quantified as in Figure 4A. (B) 3D-rendered time-sequential images of Tg(fli1:Gal4FF);(UAS:GCaMP7a);(fli1:H2B-mC) embryos during tip cell budding injected with dll4 MO (24 ss). Green and blue arrowheads indicate two neighboring Ca2+-oscillating ECs, both of which are budding from the DA. (C) The fluorescence changes in GCaMP7a (ΔF/F0) of individual ECs from B indicated by arrowheads at the left panel are shown as a graph. (D) Ca2+ oscillation frequency (left) and mean ΔF/F0 (right) in budding ECs and other ECs within the DA in dll4 morphants during tip cell budding at 24–27 ss as illustrated at the left panel (n e 13). Scale bar, 10 mm in B. ***p < 0.001. DA, dorsal aorta. |
| Genes: | |
|---|---|
| Fish: | |
| Knockdown Reagent: | |
| Anatomical Terms: | |
| Stage Range: | 20-25 somites to 26+ somites |