
Fig. 1
- ID
- ZDB-FIG-160215-16
- Publication
- Yokota et al., 2015 - Endothelial Ca(2+) oscillations reflect VEGFR signaling-regulated angiogenic capacity in vivo
- Other Figures
- All Figure Page
- Back to All Figure Page
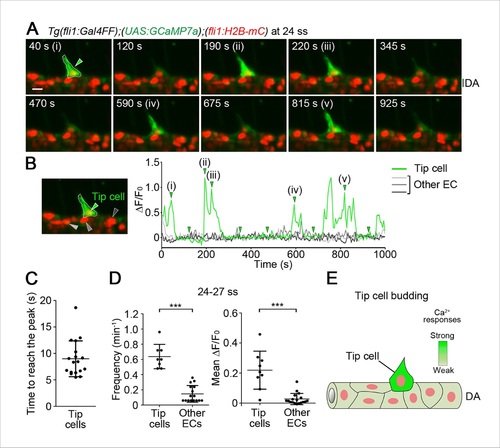
Ca2+ oscillations in tip cells during budding from the dorsal aorta (DA). (A) 3D-rendered time-sequential images of the trunk regions of Tg(fli1:Gal4FF);(UAS:GCaMP7a);(fli1:H2B-mC) embryos during vessel sprouting from the DA (24 somite stage (ss)). 3D images were acquired using a light sheet microscope. The merged images of GCaMP7a (green) and H2B-mC (red) images are shown in the following images, unless otherwise described. All the zebrafish images are lateral views and displayed as anterior to the left. A green arrowhead indicates a tip cell outlined by a dashed line. (i)-(v) and other images are those indicated by the arrowheads indicated at a graph in B. (B) The fluorescence changes in GCaMP7a (ΔF/F0) of individual ECs from A indicated by arrowheads (green, light gray, dark gray, and black) at the left panel are shown as a graph. To measure the fluorescence intensity of GCaMP7a (green) in individual EC, the cell nucleus (red) was tracked over time (see ‘Materials and methods’). (C) Dot-plot graphs depicting the time to reach the peak of each Ca2+-oscillation in tip cells. Time-lapse 2D slice images of Tg(fli1:Gal4FF);(UAS:GCaMP7a);(fli1:H2B-mC) embryos taken every 100 ms as in Figure 1—figure supplement 2B were analyzed for quantification. Horizontal lines represent mean ± s.d. (n = 18). (D) Quantification of Ca2+ oscillation frequency (left) and mean ΔF/F0 (right) in tip cells and other ECs within the DA during tip cell budding (24–27 ss) (see ‘Materials and methods’). Each dot represents the value for a single cell. Horizontal lines represent mean ± s.d. (n ≥ 8). (E) Schematic model of tip cells showing Ca2+ oscillations when they sprout from the DA. Intensity of green reflects the frequency of Ca2+ oscillations. Scale bar, 10 µm in A. ***p < 0.001. DA, dorsal aorta. |
| Genes: | |
|---|---|
| Fish: | |
| Anatomical Terms: | |
| Stage Range: | 20-25 somites to 26+ somites |