
Fig. 3
- ID
- ZDB-FIG-160215-18
- Publication
- Yokota et al., 2015 - Endothelial Ca(2+) oscillations reflect VEGFR signaling-regulated angiogenic capacity in vivo
- Other Figures
- All Figure Page
- Back to All Figure Page
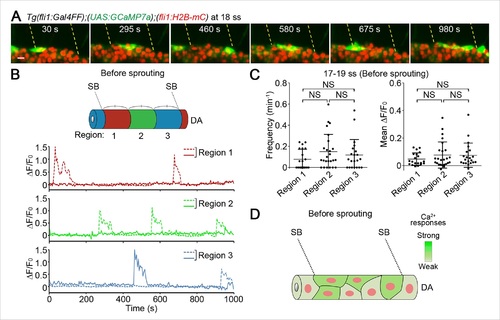
Ca2+-oscillating cells were not restricted to specific regions within the DA before vessel sprouting. (A) 3D-rendered time-sequential images of Tg(fli1:Gal4FF);(UAS:GCaMP7a);(fli1:H2B-mC) embryos before ISV sprouting (18 ss). Yellow dashed lines indicate positions of somite boundaries. (B) The DA is subdivided into three regions (Region 1–3) between two somite boundaries (SBs) as illustrated in the scheme (upper). The fluorescence changes in GCaMP7a (ΔF/F0) of individual ECs from A are shown as separate graphs (Region 1–3), determining the region to which individual EC belongs by the location based on the position of the nucleus at the start of time-lapse imaging. A representative graph of two ECs at each region is shown. (C) Quantification of Ca2+ oscillation frequency (left) and mean ΔF/F0 (right) in ECs of the indicated regions within the DA before vessel sprouting (17–19 ss). Horizontal lines represent mean ± s.d. (n ≥ 20). (D) Schematic illustration of Ca2+ dynamics before tip cell budding. Before tip cells sprout from the DA, Ca2+ oscillations are found broadly in ECs within the DA. Scale bar, 10 µm in A. NS, not significant. SB, somite boundary; DA, dorsal aorta. |
| Genes: | |
|---|---|
| Fish: | |
| Anatomical Terms: | |
| Stage: | 14-19 somites |