
Fig. 9 S3
- ID
- ZDB-FIG-160215-30
- Publication
- Yokota et al., 2015 - Endothelial Ca(2+) oscillations reflect VEGFR signaling-regulated angiogenic capacity in vivo
- Other Figures
- All Figure Page
- Back to All Figure Page
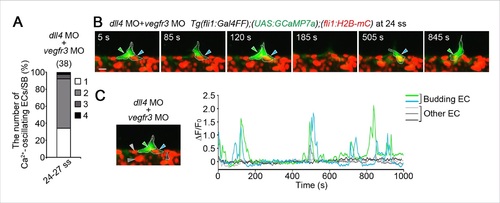
Vegfr3 is partially involved in increases in oscillating cells in dll4 morphants. (A) The number of Ca2+-oscillating ECs at each somite boundary of Tg(fli1:Gal4FF);(UAS:GCaMP7a);(fli1:H2B-mC) embryos injected with both dll4 and vegfr3 MOs was quantified at somite boundaries (total 38) at 24–27 ss as in Figure 4A. (B) 3D-rendered time-sequential images of Tg(fli1:Gal4FF);(UAS:GCaMP7a);(fli1:H2B-mC) embryos injected with both dll4 and vegfr3 MOs during tip cell budding (24 ss). Green and blue arrowheads indicate two neighboring Ca2+-oscillating ECs, both of which are budding from the DA. (C) Fluorescence changes in GCaMP7a (ΔF/F0) of individual ECs from B indicated by arrowheads at the left panel are shown as a graph. Scale bar, 10 mm in B. |