
FIGURE
Fig. 7 S2
- ID
- ZDB-FIG-160215-33
- Publication
- Yokota et al., 2015 - Endothelial Ca(2+) oscillations reflect VEGFR signaling-regulated angiogenic capacity in vivo
- Other Figures
- All Figure Page
- Back to All Figure Page
Fig. 7 S2
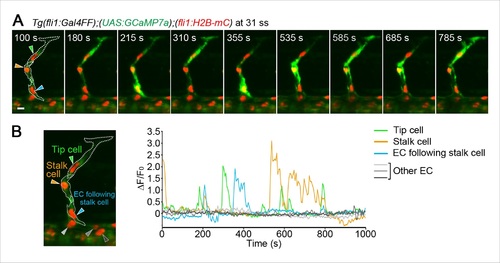
An EC following a stalk cell exhibits significant Ca2+ oscillations. (A) 3D-rendered time-sequential images of Tg(fli1:Gal4FF);(UAS:GCaMP7a);(fli1:H2B-mC) embryos at 31 ss when a EC following tip and stalk cells is budding from the DA. Green and orange arrowheads indicate tip and stalk cells, respectively. A blue arrowhead indicates an EC following a stalk cell. (B) The fluorescence changes in GCaMP7a (ΔF/F0) of individual ECs from A indicated by arrowheads (green, blue, orange, light gray, dark gray, and black) at the left panel are shown as a graph. Scale bar, 10 µm in A. |
Expression Data
Expression Detail
Antibody Labeling
Phenotype Data
Phenotype Detail
Acknowledgments
This image is the copyrighted work of the attributed author or publisher, and
ZFIN has permission only to display this image to its users.
Additional permissions should be obtained from the applicable author or publisher of the image.
Full text @ Elife