
FIGURE
Fig. 4 S2
- ID
- ZDB-FIG-160215-36
- Publication
- Yokota et al., 2015 - Endothelial Ca(2+) oscillations reflect VEGFR signaling-regulated angiogenic capacity in vivo
- Other Figures
- All Figure Page
- Back to All Figure Page
Fig. 4 S2
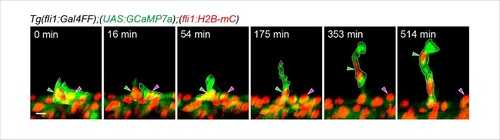
Tip cell selection between two neighboring ECs exhibiting Ca2+ oscillations. 3D-rendered time-sequential images of Tg(fli1:Gal4FF);(UAS:GCaMP7a);(fli1:H2B-mC) embryos during tip selection between two neighboring cells exhibiting Ca2+ oscillations. An EC maintaining Ca2+ oscillations became tip cell (green arrowheads), whereas an EC losing Ca2+ oscillations stayed in the DA (magenta arrowheads). A representative case among those we observed are shown (n = 18). Scale bar, 10 µm. |
Expression Data
Expression Detail
Antibody Labeling
Phenotype Data
Phenotype Detail
Acknowledgments
This image is the copyrighted work of the attributed author or publisher, and
ZFIN has permission only to display this image to its users.
Additional permissions should be obtained from the applicable author or publisher of the image.
Full text @ Elife