
Fig. 7
- ID
- ZDB-FIG-160215-22
- Publication
- Yokota et al., 2015 - Endothelial Ca(2+) oscillations reflect VEGFR signaling-regulated angiogenic capacity in vivo
- Other Figures
- All Figure Page
- Back to All Figure Page
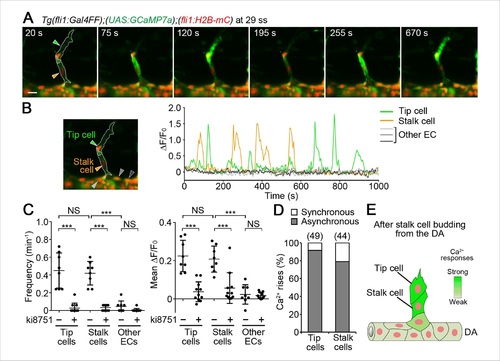
Ca2+ oscillations in tip and stalk cells that completely come out from the DA. (A) 3D-rendered time-sequential images of Tg(fli1:Gal4FF);(UAS:GCaMP7a);(fli1:H2B-mC) embryos after stalk cells migrate out of the DA (29 ss). Green and orange arrowheads indicate tip and stalk cells, respectively. (B) The fluorescence changes in GCaMP7a (ΔF/F0) of individual ECs from A indicated by arrowheads (green, orange, light gray, dark gray, and black) at the left panel are shown as a graph. (C) Quantification of Ca2+ oscillatory activity in untreated and ki8751-treated embryos after stalk cells migrate out of the DA as in A and Figure 7—figure supplement 1A, respectively. Graphs show Ca2+ oscillation frequency (left) and mean ΔF/F0 (right) in tip cells, stalk cells and other ECs within the DA in untreated and ki8751-treated embryos. (Untreated, n ≥ 8; ki8751-treated, n ≥ 11). (D) Quantification of the number of synchronous and asynchronous Ca2+ rise between tip and stalk cells. We here define the case, in which a Ca2+ rise in one cell occurs within 10 s late behind a Ca2+ rise in the other cell, as synchronous. The number of synchronous and asynchronous Ca2+ rise were quantified in tip and stalk cells. Percentages of synchronous and asynchronous Ca2+ increase to total Ca2+ increase are shown. The total number of Ca2+ rise analyzed in tip cells and stalk cells is indicated at the top. (E) Schematic illustration of Ca2+-oscillatory activity in stalk cells. Frequency of Ca2+ oscillations found in stalk cells are comparable to that in tip cells after stalk cells have completely come out from the DA. Scale bar, 10 mm in A. ***p < 0.001; NS, not significant. DA, dorsal aorta. |
| Genes: | |
|---|---|
| Fish: | |
| Anatomical Terms: | |
| Stage Range: | 26+ somites to Prim-15 |