
Fig. 4
- ID
- ZDB-FIG-160215-19
- Publication
- Yokota et al., 2015 - Endothelial Ca(2+) oscillations reflect VEGFR signaling-regulated angiogenic capacity in vivo
- Other Figures
- All Figure Page
- Back to All Figure Page
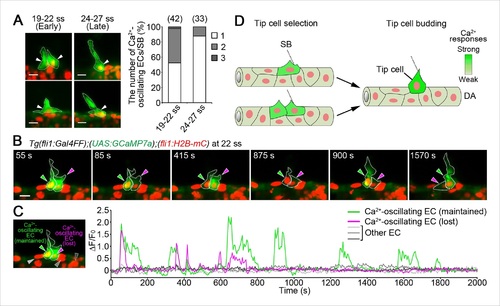
Iinitial tip cell selection in the DA. (A) The number of Ca2+-oscillating ECs within the DA at each somite boundary of Tg(fli1:Gal4FF);(UAS:GCaMP7a);(fli1:H2B-mC) embryos at 19–22 and 24–27 ss. Graph shows percentage of the number of a Ca2+-oscillating cell (1), two cells (2), and three cells (3) at a somite boundary among the total number of somite boundaries (indicated at the top) observed. Two each representative 3D-rendered images of Tg(fli1:Gal4FF);(UAS:GCaMP7a);(fli1:H2B-mC) at 19–22 and 24–27 ss are shown in the left. Arrowheads indicate Ca2+-oscillating cells. (B) 3D-rendered time-sequential images of Tg(fli1:Gal4FF);(UAS:GCaMP7a);(fli1:H2B-mC) embryos from 22 ss. Green arrowheads indicate an EC which maintained Ca2+ oscillations, whereas red arrowheads indicate an EC which lost Ca2+ oscillations. Similar results were obtained in five independent experiments. (C) The fluorescence changes in GCaMP7a (ΔF/F0) of the ECs indicated by arrowheads in B and indicated at the left panel are shown as a graph. (D) Schematic illustration of Ca2+ dynamics during tip cell budding. Ca2+ oscillations are detected mostly in a single or two-neighboring EC(s) at the onset of vessel sprouting. Finally, only single budding tip cell exhibits Ca2+-oscillation at later stages. Scale bars, 10 µm in A and B. SB, somite boundary; DA, dorsal aorta. |
| Genes: | |
|---|---|
| Fish: | |
| Anatomical Terms: | |
| Stage Range: | 14-19 somites to 26+ somites |