
Fig. 4
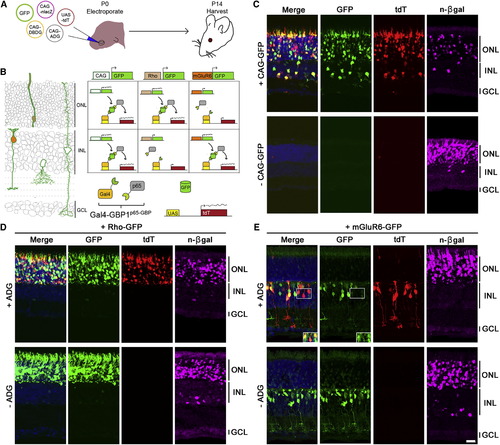
GFP Controls the Spatial Expression of Genes In Vivo (A) Schematic of experiment. (B and C) (B) (Left) In electroporated retinas, CAG-GFP expresses in multiple cell types (green outline). Rho-GFP expresses in photoreceptors of the ONL (beige fill). mGluR6-GFP expresses in ON bipolar cells of the INL (orange fill). GCL, ganglion cell layer. (Right) Anticipated UAS-tdT expression pattern aligned to left diagram (C) Gal4-GBP1p65-GBP6 induces UAS-tdT only in the presence of GFP. n-βgal (magenta) is an electroporation marker. (D and E) (Top) Rho-GFP and mGluR6-GFP induce tdT expression in rods and ON bipolar cells, respectively. (Bottom) tdT activation depends on ADG. Inset of (E) shows GFP and tdT colocalization upon GFP intensity enhancement. Merge panels includes GFP, tdT, and DAPI channels. Scale bar, 20 μm. See also Figures S3, S4, and S5 and Tables S3, S4, S5, and S6. |
Reprinted from Cell, 154(4), Tang, J.C., Szikra, T., Kozorovitskiy, Y., Teixiera, M., Sabatini, B.L., Roska, B., and Cepko, C.L., A nanobody-based system using fluorescent proteins as scaffolds for cell-specific gene manipulation, 928-939, Copyright (2013) with permission from Elsevier. Full text @ Cell