
Fig. 5
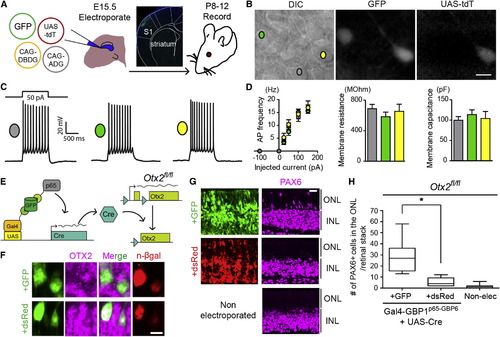
T-DDOGs Support Electrophysiological and Gene Perturbation Studies in the Central Nervous System (A) Electroporation setup for neuronal recordings. Micrograph shows GFP in electroporated primary somatosensory cortex (S1). (B–D) (B) Image of an acute brain slice from an electroporated mouse. Scale bar, 10 μm. Three categories of pyramidal layer 2/3 S1 neurons were recorded from brain slices: nonfluorescent controls (gray), GFP+ (green), and GFP+/tdT+ (yellow). (C) Representative single current-clamp trace of action potentials in response to a 50 pA, 1,000-ms-long step current injection. (D) Plots show action potential (AP) frequency upon current injection, as well as input resistance and membrane capacitance of recorded cell classes. p > 0.5 for all comparisons (n = 8–10 neurons per condition). Plots show mean ± SEM. (E–H) GFP-dependent excision of Otx2fl/fl in the retina. (E) P0, Otx2fl/fl mouse retina was electroporated with T-DDOG components and UAS-Cre and either CAG-GFP or CAG-dsRed. (F–H) (F) Loss of OTX2 was confirmed by OTX2 immunostaining and (G and H) ectopic PAX6+ ONL cells. n = 10 stacks, 5 retinas per electroporated condition. For nonelectroporated retina, n = 19 stacks, 10 retinas. Boxplots show median, maximum, and minimum values. Retinal stacks are 12-μm-thick confocal images. p < 0.001. n-βgal marks electroporated cells in (F). Scale bar, 5 μm in (F) and 20 μm in (G and H). See also Figures S6 and S7 and Table S7. |
Reprinted from Cell, 154(4), Tang, J.C., Szikra, T., Kozorovitskiy, Y., Teixiera, M., Sabatini, B.L., Roska, B., and Cepko, C.L., A nanobody-based system using fluorescent proteins as scaffolds for cell-specific gene manipulation, 928-939, Copyright (2013) with permission from Elsevier. Full text @ Cell