
Fig. S5
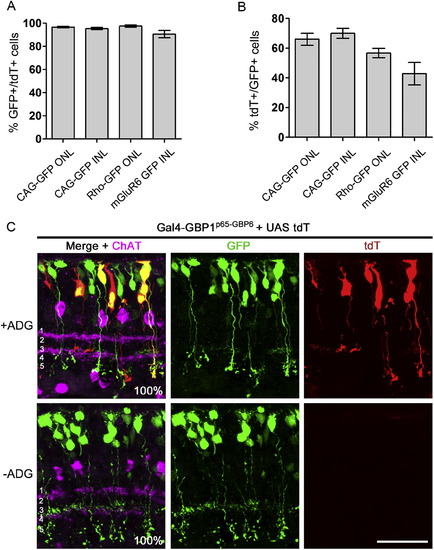
Additional Analysis of Electroporated Retinas from Figure S4, Related to Figure 4 Refer to Figure 4 and Methods for experimental setup. (A) Tight-coupling of tdT+ cells with GFP expression. Among cells that expressed tdT, the percentage of cells expressing GFP is shown. (B) Efficiency of tdT activation in GFP-expressing cells. Percentage of tdT+ cells among GFP+ cells. Note the tdT+/GFP+ data points for Rho-GFP and mGluR6-GFP were also presented in Figure S4 for a different argument. Plots show mean ± SD. See Table S3 for summary. (C) mGluR6-GFP bipolar cells project to the correct IPL sublaminae in the presence of Gal4-GBP1p65-GBP6. CD1 mouse retinas were electroporated at P0 with plasmids encoding mGluR6-GFP (green), Gal4-GBP1p65-GBP6, UAS-tdT (red) and CAG-nlacZ. Retinas stained for anti-GFP (green) and anti-ChAT (magenta). The IPL is divided into 5 sublaminae (white font in merge panels), with the ON bipolar cells stratifying below the midline dividing sublaminae 2 and 3. Anti-ChAT labels the boundary between sublaminae 1 and 2, and also the boundary between 3 and 4. % GFP+ and GFP+/tdT+ cells stratifying below the midline of 2 and 3 are shown in merge panels. n = 28 for +ADG condition and n = 31 for –ADG condition. Cells were sampled across two retinas per condition. Scale bar, 20 μm. |
Reprinted from Cell, 154(4), Tang, J.C., Szikra, T., Kozorovitskiy, Y., Teixiera, M., Sabatini, B.L., Roska, B., and Cepko, C.L., A nanobody-based system using fluorescent proteins as scaffolds for cell-specific gene manipulation, 928-939, Copyright (2013) with permission from Elsevier. Full text @ Cell