
Fig. S4
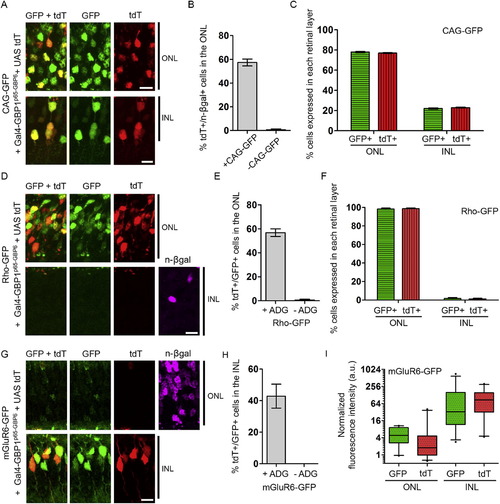
Quantification of Gal4-GBP1p65-GBP6 Activities in the Retina, Related to Figure 4 Refer to Figure 4 and Experimental Procedures for experimental setup. (A, D, and G) Colocalization of different promoter-driven GFP (green) with tdT (red) in retinas expressing Gal4-GBP1p65-GBP6. (B, E, and H) Efficiency and specificity of Gal4-GBP1p65-GBP6 in vivo. Removal of CAG-GFP (B) or ADG (E, H) abolished reporter expression. In (B), the ordinate shows the percentage of tdT-expressing cells among the electroporated cells in the ONL, as assessed by expression of the electroporation marker, n-βgal. n-βgal detection and/or expression were poor in the INL, preventing analysis of Gal4-GBP1p65-GBP6 efficiency in the INL from the sample in (B). (C and F) Distribution of GFP and tdT expressing cells in electroporated retinas. Weak, leaky mGluR6-GFP expression in the ONL made it difficult to perform this analysis by cell-counting. (I) Quantification of fluorescent intensity of cells expressing GFP and tdT in (G). Boxplots indicate median, interquartile range, and 5%–95% range. y axis is on log2 scale. n = 25 each condition. For (B), (C), (E), (F), (H), plots are mean and SD. Scale bar, 10 μm. Note the tdT+/GFP+ data points for Rho-GFP, +ADG (E) and mGluR6-GFP, +ADG (H) were also presented in Figure S5 for a different argument. |
Reprinted from Cell, 154(4), Tang, J.C., Szikra, T., Kozorovitskiy, Y., Teixiera, M., Sabatini, B.L., Roska, B., and Cepko, C.L., A nanobody-based system using fluorescent proteins as scaffolds for cell-specific gene manipulation, 928-939, Copyright (2013) with permission from Elsevier. Full text @ Cell