FIGURE SUMMARY
Title

Cadherin-16 regulates acoustic sensory gating in zebrafish through endocrine signaling

Authors
Schloss, S.S., Marshall, Z.Q., Santistevan, N.J., Gjorcheska, S., Stenzel, A., Barske, L., Nelson, J.C.
Source
Full text @ PLoS Biol.

Irresistible mutations suppress habituation and cause hypersensitivity to acoustic stimuli.

(A)irresistible mutants (n = 13) display heightened sensitivity to acoustic stimuli as compared to heterozygous and wild type (WT) siblings (n = 52). Error bars show SEM. Differences in startle sensitivity were calculated using a two-way ANOVA with a Šídák’s multiple comparisons test (**p < 0.01, ****p < 0.0001). (B)irresistible mutants (n = 14) fail to habituate to repeated acoustic stimuli when compared to siblings (n = 58), error bars show SEM. (C)irresistible mutants (n = 14) have lower habituation (****p < 0.0001, Mann–Whitney test) in relation to their siblings (n = 56). Error bars show SD. (D)irresistible mutants (n = 33) and siblings (n = 80) have no difference (p = 0.8615, Mann–Whitney test) in their response to dark flash stimuli. Error bars show SD. (E)irresistible mutants (n = 33) and siblings (n = 80) display no differences in habituation to dark flash stimuli (p = 0.0686, Mann–Whitney test). Error bars show SD. (F)irresistible mutants (n = 32) have no differences (p = 0.2983, unpaired t test) in light flash reactivity as compared to their siblings (n = 37). Error bars show SD. (G)irresistible mutants (n = 20) display normal visual motor (VMR) behaviors relative to their siblings (n = 52). (H)irresistible mutants (n = 20) and siblings (n = 52) display no difference (p = 0.2471, Mann–Whitney test) in their responses to whole field illumination in VMR assay. (I)irresistible mutants (n = 20) and siblings (n = 52) do not show significantly different responses to whole field loss-of-illumination in VMR assay (p = 0.7223, Mann–Whitney test). Error bars show SD. (J)irresistible mutants (n = 54) and siblings (n = 42) have no significant differences in their movement at baseline temperature (p = 0.0877, two-way ANOVA with Šídák’s multiple comparisons test) and both respond to high temperature with increased locomotion (difference between mutants and siblings: p = 0.1231, two-way ANOVA with Šídák’s multiple comparisons test). The data underlying this figure can be found in S1 Data.

Irresistiblep173 is an allele of the Cadherin-encoding gene cdh16.

(A) Conceptual translation of cdh16 and the predicted consequences of the irresistiblep173, and cdh16co79 mutations. (B)cdh16co79 mutants (n = 39) have decreased thresholds to low intensity acoustic stimuli as compared to their siblings (n = 33) (*p = 0.0319, ****p < 0.0001, two-way ANOVA with Šídák’s multiple comparisons test). (C)cdh16co79 mutants (n = 39) continue responding to repeated acoustic stimuli while their siblings (n = 33) habituate. (D)cdh16co79 mutants (n = 39) have significantly impaired habituation (****p < 0.0001, Mann–Whitney test) compared to siblings (n = 32). (E)cdh16p173/cdh16co79 transheterozygotes (n = 22) have increased sensitivity to acoustic stimuli when compared to cdh16p173 heterozygotes (n = 17), cdh16co79 heterozygotes (n = 14), and wild types (n = 16). A two-way ANOVA with Tukey’s multiple comparisons test was used to calculate the difference in SLC% between all groups. Differences between cdh16p173/co79 versus WT (+/+) are represented with p values on the plot: ***p = 0.0005, for the difference between WT and transheterozygotes, *p < 0.03, **p = 0.0086. (F)cdh16p173/cdh16co79 transheterozygotes (n = 19) fail to habituate to high intensity acoustic stimuli while wild type (n = 17), cdh16co79 heterozygotes (n = 10), and cdh16p173 heterozygotes (n = 26) habituate normally. (G)cdh16p173/cdh16co79 transheterozygotes (n = 19) have significantly lower habituation percentages p < 0.0001 compared to wild types (n = 17), cdh16co79 heterozygotes (n = 10), and cdh16p173 heterozygotes (n = 25). Differences in habituation between groups were calculated using a two-way ANOVA with Tukey’s multiple comparisons test. Error bars in B, C, E, and F indicate SEM. Error bars in D and G indicate SD. The data underlying this figure can be found in S1 Data.

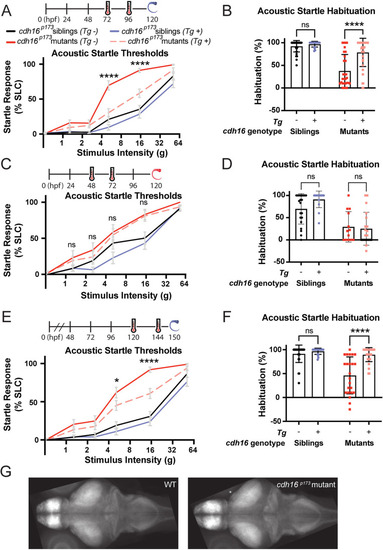
Ubiquitous expression of cdh16 after circuit development restores habituation and acoustic sensitivity.

(A)hsp70p:cdh16-p2a-mKate expression was induced at 72 and 96 hpf (hours post-fertilization) via heat-shock. Behavior testing and analysis performed at 120 hpf. Induction of cdh16 expression in cdh16p173 mutants (n = 38) results in significantly lower startle sensitivity compared to cdh16p173 mutants that are heat-shocked but do not carry the transgene (n = 25). ****p < 0.0001. (B) Heat-shock as in A has no effect on habituation (p = 0.7204) of siblings (n = 41 with the transgene versus n = 26 without). In contrast, heat-shock induction of cdh16 expression significantly restores habituation (p < 0.0001) in cdh16p173 mutants carrying the transgene (n = 38) in comparison to transgene negative mutants (n = 29). (C)hsp70p:cdh16-p2a-mKate expression was induced at 48 and 72 hpf via heat-shock. Behavior testing and analysis performed at 120 hpf. Acoustic startle sensitivity is not significantly restored in cdh16p173 mutants carrying the heat-shock transgene (n = 19) when compared to mutants with no transgene (n = 13). These data are consistent with a requirement for maintenance of cdh16 expression during behavior (p > 0.7 for all stimulus intensities). (D) Heat-shock as in C has no effect on habituation (p = 0.1073) in siblings expressing the transgene (n = 15) in relation to siblings not expressing the transgene (n = 21). Similarly, the difference in acoustic startle habituation in transgene-expressing mutants (n = 19) and mutants not expressing the transgene (n = 13) is not significant (p = 0.9199). (E)hsp70p:cdh16-p2a-mKate expression was induced at 120 and 144 hpf (after the acoustic startle circuit is functional) via heat-shock. Behavior testing and analysis performed at 150 hpf. Hypersensitivity is rescued in cdh16p173 mutants (n = 27) carrying the transgene as compared to mutants lacking the transgene (n = 20). (*p = 0.0380, ****p < 0.0001). (F) Heat-shock as in E has no effect on acoustic startle habituation (p = 0.6607) in siblings carrying the transgene (n = 21) compared to siblings lacking the transgene (n = 28). Conversely, cdh16 expression restores habituation to acoustic stimuli (p < 0.0001) in mutants carrying the transgene (n = 31) as compared to mutants without the transgene (n = 23). For A, C, and E, error bars indicate SEM. For B, D, and F, error bars indicate SD. (G) Representative whole-brain stacks for WT (n = 16) (left) and cdh16p173 mutants (n = 13) (right), showing a lack of brain volume changes at 6 dpf. The data underlying this figure can be found in S1 Data.

cdh16 is expressed in the corpuscles of Stannius (CS) during embryonic and larval development.

(A–G) Whole-mount in situ hybridization chain reaction (HCR) using probes against sequences contained within the cdh16co120 large deletion (A), or full cdh16 probe set (B–G). Maximum projections of confocal stacks show the whole larval zebrafish (A), pronephros (B), and corpuscles (C–G). (A) At 120 hpf, cdh16 is expressed in the corpuscles of Stannius (red box). Background signal is observed elsewhere, including in the eyes and head. (B)cdh16 puncta are enriched in distal pronephros where the CS will be extruded. (C–F)cdh16 signal is present in the CS and kidney from 48 hpf to 120 hpf. (G) By 144 hpf cdh16 signal is present in the CS but is no longer detectable in the kidney. Shown are representative images, n = 5 larvae were imaged for whole-body and per time point.

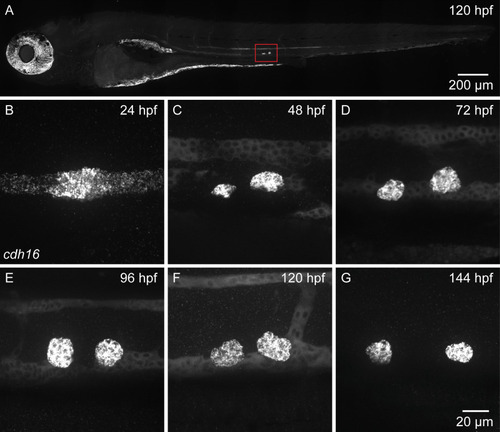
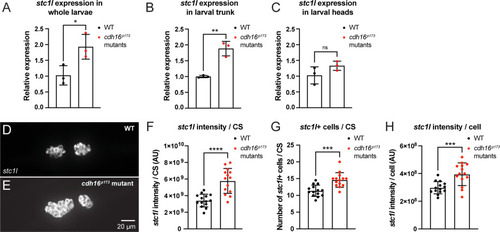
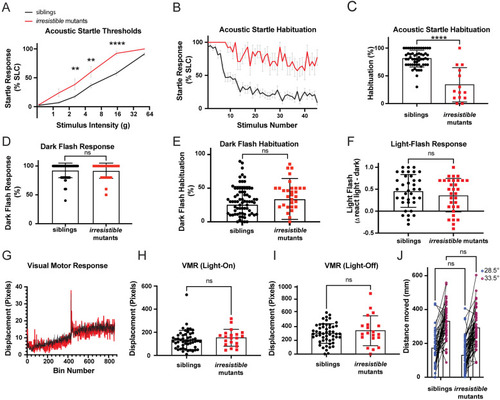
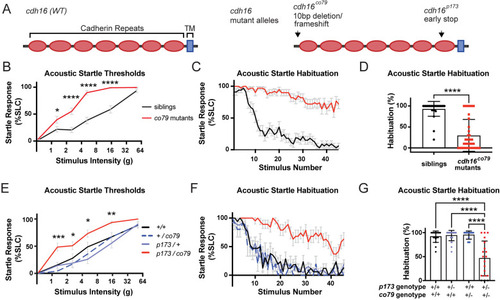
Cadherin-16 suppresses stc1l expression in the CS.

(A–C) RT-qPCR analysis of stc1l expression in cdh16p173 mutants. (A) Expression of stc1l is significantly increased in cdh16 mutants compared to WT. n = 3 biological replicates per condition, n = 7 larvae per biological replicate, *p = 0.03 unpaired t test. Error bars represent SD. (B–C) The increase in stc1l expression in cdh16 mutants is observed specifically in trunk tissue, which includes the distal pronephros and CS (B)n = 3 biological replicates per condition, n = 10 larvae per biological replicate, **p = 0.003, unpaired t test, and not the head (C)n = 3 biological replicates per condition, n = 10 larvae per biological replicate, ns indicates p = 0.16, unpaired t test. Error bars represent SD. (D-H)stc1l in situ HCR in the CS of cdh16p173 mutants. (D–E) Comparison of the corpuscles of Stannius (CS) between cdh16 mutants (bottom) and WT siblings (top). (F–H)cdh16 mutants (n = 15) have increased stc1l expression per CS (****p < 0.0001 unpaired t test) (F), increased stc1l-positive cells per CS (***p = 0.0002 unpaired t test) (G), and increased stc1l expression per CS cell (***p = 0.0006), compared to WT (n = 15) (H). Error bars represent SD. The data underlying this figure can be found in S1 Data.

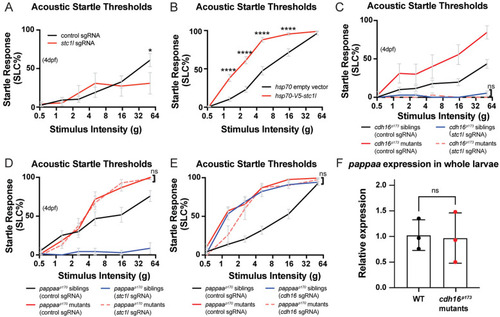
Cadherin-16 promotes startle thresholds by limiting Stanniocalcin 1l expression and promoting Papp-aa function.

(A)stc1l crispants (n = 18) have a decreased response to acoustic stimuli compared to control guide-injected larvae (n = 18) *p = 0.0475, two-way ANOVA with Šídák’s multiple comparisons test. Error bars represent SEM. (B) Heat-shock overexpression of V5-tagged stc1l at 4 dpf causes increased sensitivity to acoustic stimuli at 5 dpf (n = 54) compared to overexpression of empty heat-shock vector (n = 53) (****p < 0.0001, two-way ANOVA with Šídák’s multiple comparisons test). Error bars represent SEM. (C) Genetic epistasis to examine the relationship between stc1l and cdh16 in the context of acoustic startle thresholds. stc1l mutations suppress the cdh16 mutant phenotype. cdh16 mutants injected with stc1l guides (n = 10) are not more responsive than siblings injected with stc1l guides alone (n = 44) p > 0.9 for all stimulus intensities, two-way ANOVA with Tukey’s multiple comparisons test. Error bars represent SEM. (D)pappaa mutations suppress the stc1l crispant phenotype. stc1l guide-injected pappaa mutant larvae (n = 14) are no more hyposensitive than control guide injected pappaa mutants (n = 12) p > 0.9827 for all stimulus intensities, two-way ANOVA with Tukey’s multiple comparisons test. Error bars represent SEM. (E) Loss-of-function mutations in cdh16 and pappaa do not cause additive hypersensitivity phenotypes. pappaa mutants injected with cdh16 guides (n = 8) are no more hypersensitive than control guide injected pappaa mutants (n = 18), p > 0.8 at all intensities except for 1.3g, where p = 0.0389, and control-guide injected are more sensitive than cdh16 guide-injected pappaa mutants, two-way ANOVA with Tukey’s multiple comparisons test. (F) RT-qPCR analysis of pappaa mRNA levels. pappaa expression is not altered in cdh16p173 mutants as compared to their WT siblings (n = 3 biological replicates per condition, n = 7 larvae per biological replicate, p = 0.87, unpaired t test). Error bars represent SD. The data underlying this figure can be found in S1 Data.

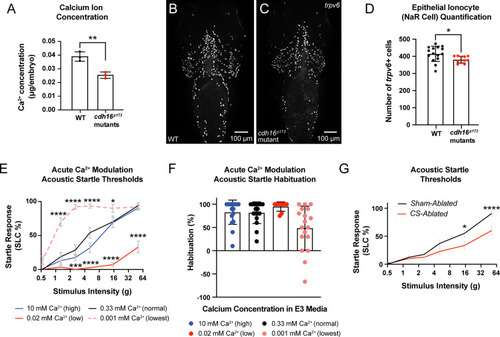
The corpuscles of Stannius (CS) and Ca2
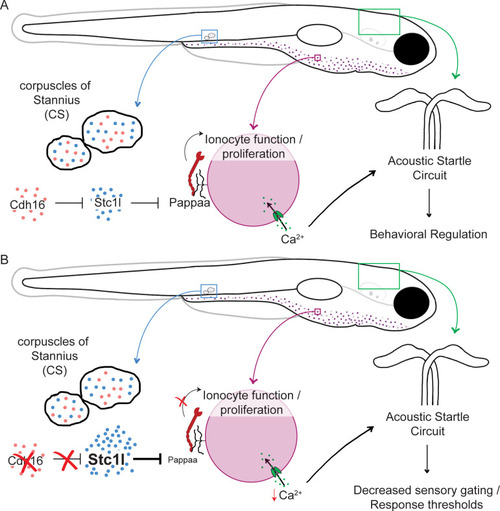
+homeostasis are important regulators of behavioral thresholds.(A)cdh16 mutants have decreased whole-body Ca2+ compared to WT (n = 3 biological replicates per condition, **p = 0.0048, unpaired t test). Error bars represent SD. (B–C) Epithelial ionocytes involved in Ca2+ uptake (NaR cells) visualized via whole mount in situ HCR for trpv6 in WT (B) and cdh16p173 mutants (C). (D)cdh16 mutants (n = 11) have fewer ionocytes compared to WT (n = 15) *p = 0.0278, unpaired t test. Error bars represent SD. (E–F) Acute (four hour) exposure to media with altered Ca2+ concentration alters sensory thresholds and habituation to acoustic stimuli. (E) Larvae exposed to the lowest concentration of Ca2+ (0.001 mM Ca2+) four hours before behavior testing have increased sensitivity to acoustic stimuli (n = 18) compared to larvae exposed to normal levels of Ca2+ (0.33 mM) (n = 17); ****p < 0.0001, *p = 0.02. Larvae exposed to an intermediate-low level of Ca2+ (0.02 mM, n = 17) conversely, have reduced responses to acoustic stimuli relative to normal Ca2+ (0.33 mM) (n = 17) ***p = 0.0004, ****p < 0.0001, two-way ANOVA with Dunnett’s multiple comparison’s test. Error bars represent SEM. (F) Larvae in the lowest concentration of Ca2+ trended towards a failure to habituate to acoustic stimuli (n = 18) relative to larvae exposed to normal levels of Ca2+ (0.33 mM, n = 17) p = 0.0653, Kruskal–Wallis test with Dunn’s multiple comparisons test. Error bars represent SD. (G) Laser-ablation of the Ca2+-regulatory corpuscles of Stannius (CS) causes decreased sensitivity to acoustic stimuli (n = 20), compared to sham ablated siblings (n = 20) *p = 0.012, ****p < 0.0001, two-way ANOVA with Šídák’s multiple comparisons test. Error bars indicate SEM. The data underlying this figure can be found in S1 Data.

Proposed model.

(A) In wild type animals, Cdh16 suppresses stc1l expression in the corpuscles of Stannius. This limits the ability of Stc1l to suppress the function of Papp-aa, allowing for some proliferation and function of ionocytes. As a result, Ca2+ is taken up from the environment and normal acoustic startle thresholds are maintained. (B) In cdh16 mutant animals, suppression of stc1l expression is relieved and stc1l is overexpressed. This results in hyper-inhibition of Papp-aa. As a result, Ca2+ uptake is severely limited, animals are hypocalcemic, and acoustic response thresholds are lowered.

Acknowledgments
This image is the copyrighted work of the attributed author or publisher, and ZFIN has permission only to display this image to its users. Additional permissions should be obtained from the applicable author or publisher of the image. Full text @ PLoS Biol.