IMAGE

Fig 6

ID
ZDB-IMAGE-250515-8
Source
Figures for Schloss et al., 2025
Image
Figure Caption

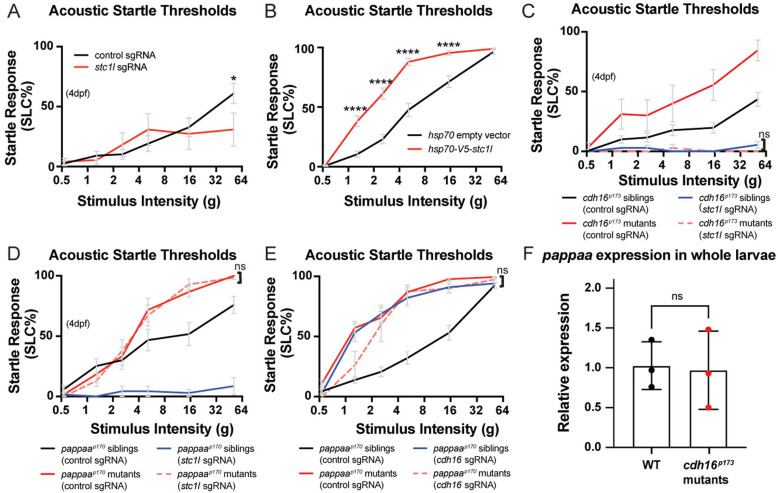
Fig 6 Cadherin-16 promotes startle thresholds by limiting Stanniocalcin 1l expression and promoting Papp-aa function.

(A)stc1l crispants (n = 18) have a decreased response to acoustic stimuli compared to control guide-injected larvae (n = 18) *p = 0.0475, two-way ANOVA with Šídák’s multiple comparisons test. Error bars represent SEM. (B) Heat-shock overexpression of V5-tagged stc1l at 4 dpf causes increased sensitivity to acoustic stimuli at 5 dpf (n = 54) compared to overexpression of empty heat-shock vector (n = 53) (****p < 0.0001, two-way ANOVA with Šídák’s multiple comparisons test). Error bars represent SEM. (C) Genetic epistasis to examine the relationship between stc1l and cdh16 in the context of acoustic startle thresholds. stc1l mutations suppress the cdh16 mutant phenotype. cdh16 mutants injected with stc1l guides (n = 10) are not more responsive than siblings injected with stc1l guides alone (n = 44) p > 0.9 for all stimulus intensities, two-way ANOVA with Tukey’s multiple comparisons test. Error bars represent SEM. (D)pappaa mutations suppress the stc1l crispant phenotype. stc1l guide-injected pappaa mutant larvae (n = 14) are no more hyposensitive than control guide injected pappaa mutants (n = 12) p > 0.9827 for all stimulus intensities, two-way ANOVA with Tukey’s multiple comparisons test. Error bars represent SEM. (E) Loss-of-function mutations in cdh16 and pappaa do not cause additive hypersensitivity phenotypes. pappaa mutants injected with cdh16 guides (n = 8) are no more hypersensitive than control guide injected pappaa mutants (n = 18), p > 0.8 at all intensities except for 1.3g, where p = 0.0389, and control-guide injected are more sensitive than cdh16 guide-injected pappaa mutants, two-way ANOVA with Tukey’s multiple comparisons test. (F) RT-qPCR analysis of pappaa mRNA levels. pappaa expression is not altered in cdh16p173 mutants as compared to their WT siblings (n = 3 biological replicates per condition, n = 7 larvae per biological replicate, p = 0.87, unpaired t test). Error bars represent SD. The data underlying this figure can be found in S1 Data.

Acknowledgments
This image is the copyrighted work of the attributed author or publisher, and ZFIN has permission only to display this image to its users. Additional permissions should be obtained from the applicable author or publisher of the image. Full text @ PLoS Biol.