IMAGE

Fig 1

ID
ZDB-IMAGE-250515-4
Source
Figures for Schloss et al., 2025
Image
Figure Caption

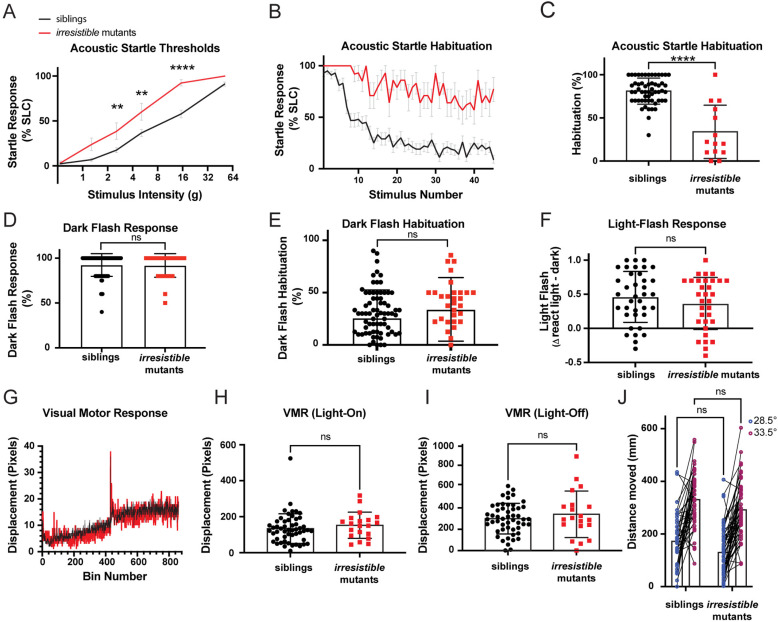
Fig 1 Irresistible mutations suppress habituation and cause hypersensitivity to acoustic stimuli.

(A)irresistible mutants (n = 13) display heightened sensitivity to acoustic stimuli as compared to heterozygous and wild type (WT) siblings (n = 52). Error bars show SEM. Differences in startle sensitivity were calculated using a two-way ANOVA with a Šídák’s multiple comparisons test (**p < 0.01, ****p < 0.0001). (B)irresistible mutants (n = 14) fail to habituate to repeated acoustic stimuli when compared to siblings (n = 58), error bars show SEM. (C)irresistible mutants (n = 14) have lower habituation (****p < 0.0001, Mann–Whitney test) in relation to their siblings (n = 56). Error bars show SD. (D)irresistible mutants (n = 33) and siblings (n = 80) have no difference (p = 0.8615, Mann–Whitney test) in their response to dark flash stimuli. Error bars show SD. (E)irresistible mutants (n = 33) and siblings (n = 80) display no differences in habituation to dark flash stimuli (p = 0.0686, Mann–Whitney test). Error bars show SD. (F)irresistible mutants (n = 32) have no differences (p = 0.2983, unpaired t test) in light flash reactivity as compared to their siblings (n = 37). Error bars show SD. (G)irresistible mutants (n = 20) display normal visual motor (VMR) behaviors relative to their siblings (n = 52). (H)irresistible mutants (n = 20) and siblings (n = 52) display no difference (p = 0.2471, Mann–Whitney test) in their responses to whole field illumination in VMR assay. (I)irresistible mutants (n = 20) and siblings (n = 52) do not show significantly different responses to whole field loss-of-illumination in VMR assay (p = 0.7223, Mann–Whitney test). Error bars show SD. (J)irresistible mutants (n = 54) and siblings (n = 42) have no significant differences in their movement at baseline temperature (p = 0.0877, two-way ANOVA with Šídák’s multiple comparisons test) and both respond to high temperature with increased locomotion (difference between mutants and siblings: p = 0.1231, two-way ANOVA with Šídák’s multiple comparisons test). The data underlying this figure can be found in S1 Data.

Acknowledgments
This image is the copyrighted work of the attributed author or publisher, and ZFIN has permission only to display this image to its users. Additional permissions should be obtained from the applicable author or publisher of the image. Full text @ PLoS Biol.