|
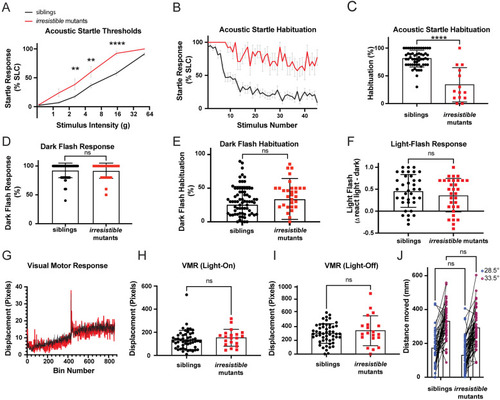
Irresistible mutations suppress habituation and cause hypersensitivity to acoustic stimuli. (A)irresistible mutants (n = 13) display heightened sensitivity to acoustic stimuli as compared to heterozygous and wild type (WT) siblings (n = 52). Error bars show SEM. Differences in startle sensitivity were calculated using a two-way ANOVA with a Šídák’s multiple comparisons test (**p < 0.01, ****p < 0.0001). (B)irresistible mutants (n = 14) fail to habituate to repeated acoustic stimuli when compared to siblings (n = 58), error bars show SEM. (C)irresistible mutants (n = 14) have lower habituation (****p < 0.0001, Mann–Whitney test) in relation to their siblings (n = 56). Error bars show SD. (D)irresistible mutants (n = 33) and siblings (n = 80) have no difference (p = 0.8615, Mann–Whitney test) in their response to dark flash stimuli. Error bars show SD. (E)irresistible mutants (n = 33) and siblings (n = 80) display no differences in habituation to dark flash stimuli (p = 0.0686, Mann–Whitney test). Error bars show SD. (F)irresistible mutants (n = 32) have no differences (p = 0.2983, unpaired t test) in light flash reactivity as compared to their siblings (n = 37). Error bars show SD. (G)irresistible mutants (n = 20) display normal visual motor (VMR) behaviors relative to their siblings (n = 52). (H)irresistible mutants (n = 20) and siblings (n = 52) display no difference (p = 0.2471, Mann–Whitney test) in their responses to whole field illumination in VMR assay. (I)irresistible mutants (n = 20) and siblings (n = 52) do not show significantly different responses to whole field loss-of-illumination in VMR assay (p = 0.7223, Mann–Whitney test). Error bars show SD. (J)irresistible mutants (n = 54) and siblings (n = 42) have no significant differences in their movement at baseline temperature (p = 0.0877, two-way ANOVA with Šídák’s multiple comparisons test) and both respond to high temperature with increased locomotion (difference between mutants and siblings: p = 0.1231, two-way ANOVA with Šídák’s multiple comparisons test). The data underlying this figure can be found in S1 Data.
|