|
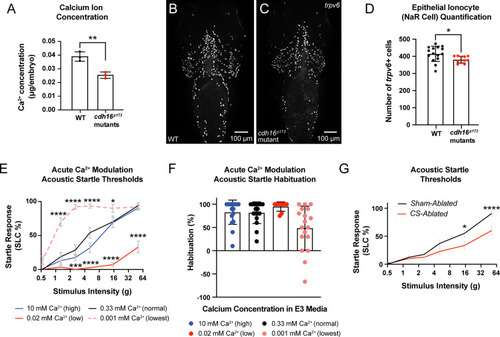
The corpuscles of Stannius (CS) and Ca2 +homeostasis are important regulators of behavioral thresholds.(A)cdh16 mutants have decreased whole-body Ca2+ compared to WT (n = 3 biological replicates per condition, **p = 0.0048, unpaired t test). Error bars represent SD. (B–C) Epithelial ionocytes involved in Ca2+ uptake (NaR cells) visualized via whole mount in situ HCR for trpv6 in WT (B) and cdh16p173 mutants (C). (D)cdh16 mutants (n = 11) have fewer ionocytes compared to WT (n = 15) *p = 0.0278, unpaired t test. Error bars represent SD. (E–F) Acute (four hour) exposure to media with altered Ca2+ concentration alters sensory thresholds and habituation to acoustic stimuli. (E) Larvae exposed to the lowest concentration of Ca2+ (0.001 mM Ca2+) four hours before behavior testing have increased sensitivity to acoustic stimuli (n = 18) compared to larvae exposed to normal levels of Ca2+ (0.33 mM) (n = 17); ****p < 0.0001, *p = 0.02. Larvae exposed to an intermediate-low level of Ca2+ (0.02 mM, n = 17) conversely, have reduced responses to acoustic stimuli relative to normal Ca2+ (0.33 mM) (n = 17) ***p = 0.0004, ****p < 0.0001, two-way ANOVA with Dunnett’s multiple comparison’s test. Error bars represent SEM. (F) Larvae in the lowest concentration of Ca2+ trended towards a failure to habituate to acoustic stimuli (n = 18) relative to larvae exposed to normal levels of Ca2+ (0.33 mM, n = 17) p = 0.0653, Kruskal–Wallis test with Dunn’s multiple comparisons test. Error bars represent SD. (G) Laser-ablation of the Ca2+-regulatory corpuscles of Stannius (CS) causes decreased sensitivity to acoustic stimuli (n = 20), compared to sham ablated siblings (n = 20) *p = 0.012, ****p < 0.0001, two-way ANOVA with Šídák’s multiple comparisons test. Error bars indicate SEM. The data underlying this figure can be found in S1 Data.
|