|
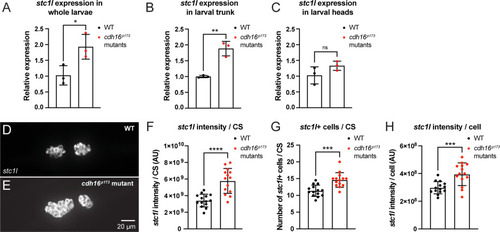
Cadherin-16 suppresses stc1l expression in the CS. (A–C) RT-qPCR analysis of stc1l expression in cdh16p173 mutants. (A) Expression of stc1l is significantly increased in cdh16 mutants compared to WT. n = 3 biological replicates per condition, n = 7 larvae per biological replicate, *p = 0.03 unpaired t test. Error bars represent SD. (B–C) The increase in stc1l expression in cdh16 mutants is observed specifically in trunk tissue, which includes the distal pronephros and CS (B)n = 3 biological replicates per condition, n = 10 larvae per biological replicate, **p = 0.003, unpaired t test, and not the head (C)n = 3 biological replicates per condition, n = 10 larvae per biological replicate, ns indicates p = 0.16, unpaired t test. Error bars represent SD. (D-H)stc1l in situ HCR in the CS of cdh16p173 mutants. (D–E) Comparison of the corpuscles of Stannius (CS) between cdh16 mutants (bottom) and WT siblings (top). (F–H)cdh16 mutants (n = 15) have increased stc1l expression per CS (****p < 0.0001 unpaired t test) (F), increased stc1l-positive cells per CS (***p = 0.0002 unpaired t test) (G), and increased stc1l expression per CS cell (***p = 0.0006), compared to WT (n = 15) (H). Error bars represent SD. The data underlying this figure can be found in S1 Data.
|