IMAGE

Fig 5

ID
ZDB-IMAGE-250515-7
Source
Figures for Schloss et al., 2025
Image
Figure Caption

Fig 5 
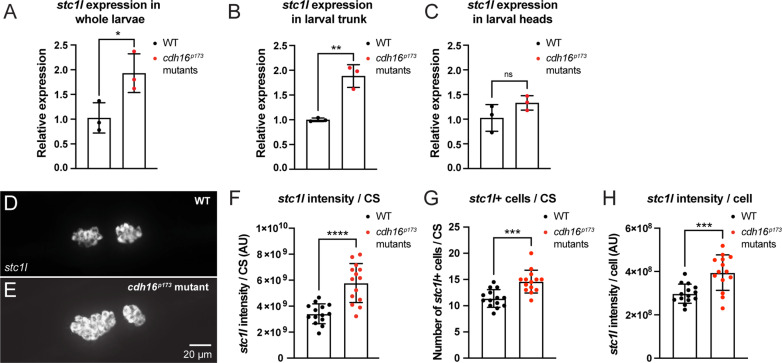
Cadherin-16 suppresses stc1l expression in the CS.

(A–C) RT-qPCR analysis of stc1l expression in cdh16p173 mutants. (A) Expression of stc1l is significantly increased in cdh16 mutants compared to WT. n = 3 biological replicates per condition, n = 7 larvae per biological replicate, *p = 0.03 unpaired t test. Error bars represent SD. (B–C) The increase in stc1l expression in cdh16 mutants is observed specifically in trunk tissue, which includes the distal pronephros and CS (B)n = 3 biological replicates per condition, n = 10 larvae per biological replicate, **p = 0.003, unpaired t test, and not the head (C)n = 3 biological replicates per condition, n = 10 larvae per biological replicate, ns indicates p = 0.16, unpaired t test. Error bars represent SD. (D-H)stc1l in situ HCR in the CS of cdh16p173 mutants. (D–E) Comparison of the corpuscles of Stannius (CS) between cdh16 mutants (bottom) and WT siblings (top). (F–H)cdh16 mutants (n = 15) have increased stc1l expression per CS (****p < 0.0001 unpaired t test) (F), increased stc1l-positive cells per CS (***p = 0.0002 unpaired t test) (G), and increased stc1l expression per CS cell (***p = 0.0006), compared to WT (n = 15) (H). Error bars represent SD. The data underlying this figure can be found in S1 Data.

Acknowledgments
This image is the copyrighted work of the attributed author or publisher, and ZFIN has permission only to display this image to its users. Additional permissions should be obtained from the applicable author or publisher of the image. Full text @ PLoS Biol.