
- Title
-
Loss of carbohydrate sulfotransferase 6 function leads to macular corneal dystrophy phenotypes and skeletal defects in zebrafish
- Authors
- Basol, M., Ersoz-Gulseven, E., Ozaktas, H., Kalyoncu, S., Utine, C.A., Cakan-Akdogan, G.
- Source
- Full text @ FEBS J.
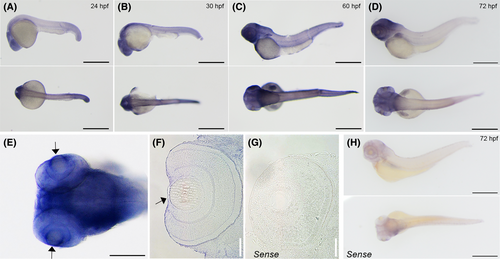
The expression pattern of chst6 in zebrafish embryos. Whole mount in situ hybridization revealed expression of chst6 in the body of (A) 24 hpf, (B) 30 hpf, (C) 60 hpf, and (D) 72 hpf zebrafish. (E) Close-up image of the 72 hpf larval head shows strong expression in the brain and eye (arrow). The experiment was repeated three times and n = 15 for each stage. (F) Section of larvae post-in situ hybridization shows chst6 expression in the cornea (arrow); (G) larvae stained with negative control sense probe did not show any signal in the eye. (H) Representative images of 72 hpf larvae stained with chst6 sense probe (negative control). Scale bars: 100 μm. EXPRESSION / LABELING:
|
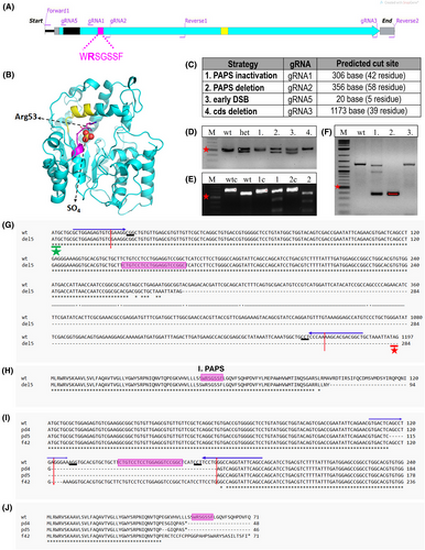
chst6 mutagenesis strategy. (A) Graphical representation of chst6 gene cds. Carbohydrate sulfotransferase domain (turquoise), 1st PAPS (magenta), and 2nd PAPS (yellow) and transmembrane (black) domains are colored. Primers used for generating the PCR product for genotyping of PAPS domain mutants (forward 1, reverse 1); cds deletion mutant or Sanger sequencing (forward 1, reverse 2); and gRNA binding sites are indicated. (B) Model of zebrafish CHST6 sulfotransferase domain indicating localization of 1st PAPS (a.a. 49–55, magenta) and 2nd PAPS (a.a. 202–210, yellow) and SO4 interaction with Arg53. Model was generated with the pymol Software. (C) Mutagenesis strategies and used gRNA annotations are shown. gRNA1 was used for the inactivation of the 1st PAPS domain by indel generation, gRNA1 and gRNA2 were used together to induce deletion of the 1st PAPS domain, gRNA5 was used to induce early indel before the transmembrane domain, and gRNA3 and gRNA5 were used together to induce deletion of the coding sequence. (D–F) Representative agarose gel images of genotyping analyses; (D) PAPS deletion (pd) mutation leads to generation of a 50 bp shorter mutant fragment. Lanes: marker, wt, heterozygous mutant, test fish 1, 2, 3, and 4 PCR products, (E) gRNA1 induced indel/frameshift (f) mutations were detected with T7EI assay. Presence of mutant DNA strand leads to formation of a mismatch and digestion by T7E1. Lanes: marker, wt control, wt digested, fish 1 control, fish 1 digested, fish 2 control, fish 2 digested PCR products. (F) F1 embryos obtained from founder fish of the cds deletion (del5) mutation were genotyped with PCR. chst6 genomic region was amplified with forward 1 and reverse 2 primers. Heterozygous embryo 1 had 3 bands (wt, mutant, and heteroduplex), whereas embryo 2 had only the short band, and nonmutant embryo 3 had the wt DNA band. Short band was expected to be 150–160 bp, but a longer band was detected. Red asterisk shows 500 bp marker band in all gels. (G–J) Sequence alignments of obtained mutants with wt chst6 (NM_001130621) were generated with clustal omega web tool. gRNA binding sequences are indicated with arrows on top, predicted DSB site is indicated with red vertical arrow, 1st PAPS coding sequence is highlighted with magenta, PAM sequence is underlined, and start codon is indicated with a green asterisk. (G) DNA sequence, (H) protein sequence alignment of del5 mutant to wt, multiple sequence alignment of (I) DNA sequence, (J) protein sequence of homozygous mutants (chst6pd4/pd4, chst6pd5/pd5, and chst6f42/f42) with wt. |
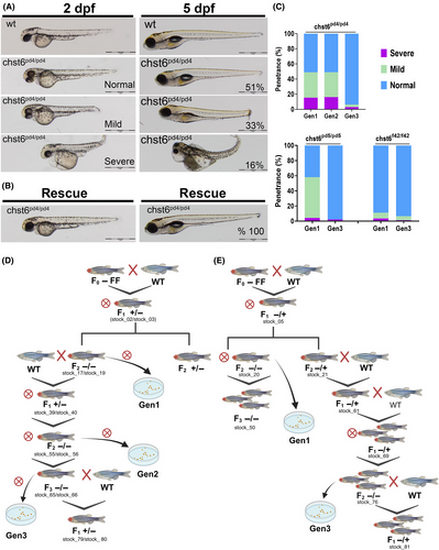
Low penetrance morphological defects were observed in the mutant embryos. (A, B) Morphology of the wt, mutant, and mRNA-injected mutant embryos was analyzed at 2 and 5 dpf. Scale bars: 1 mm. (A) While majority of embryos displayed normal morphology, 33% had mild bending at the anterior end of the tail, 16% had severe defects including bending of the anterior trunk, hearth, and yolk edema at 2 dpf (left), and these phenotypes became more severe at 5 dpf (right) and they were nearly lethal with prominent edema in heart and yok, underdeveloped head, and grossly curved trunk (n = 113). (B) The morphological defects were fully rescued when wt chst6 mRNA was injected to 1-cell stage embryo, with 100% of the mutants has normal morphology at 2 and 5 dpf (n = 68). (C) Penetrance of morphological defect phenotype was analyzed at different generation in all three alleles, and ratios are shown in graphs. The defects were observed in < 5% of the mutants in generation (gen)2 and gen3 (n = 54, 84 and 226 for gen1, gen2, and gen3 of chst6pd4/pd4; n = 119 and 44 for gen1 and gen3 of chstpd5/pd5; n = 290 and 84 for gen1 and gen3 of chst6f42/f42, respectively). The breeding schemes for zebrafish mutant lines are illustrated in (D) for chst6pd4/pd4 and chst6pd5/pd5, (E) for chst6f42/f42 mutant lines. Generations depicted in graphs (in C) are defined in the crossing schemes. Circled cross indicates inbreeding. D and E were created with BioRender.com |
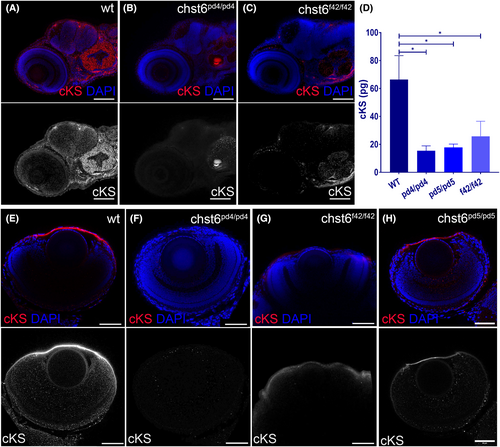
chst6 loss-of-function mutant phenotypes are rescued with wt mRNA. Loss of function was tested with cKS antibody using immunofluorescence and ELISA. (A) cKS epitopes are detected in the brain and otic vesicle of wt larvae at 4 dpf. The cKS signal is decreased in (B) chst6pd4/pd4 (C) chst6f42/f42 mutant larvae. (D) Total cKS in larval whole-body extracts were measured and displayed in the graph, and mean ± std values are wt: 66.36 ± 24.30 pg, chst6pd4/pd4: 15.46 ± 6 pg, chst6pd5/pd5: 17.83 ± 4.09 pg, chst6f42/f42: 25.81 ± 18.59 pg (n = 50, 3 replicates for each group, one-way ANOVA was used for statistical analysis). Corneal cKS signal is detected in wt (E). Lost in all mutants (F) chst6pd4/pd4, (G) chst6f42/f42 eye IF stainings are shown as examples. (H) cKS staining is rescued when wt mRNA is injected into 1-cell stage mutant embryos. P < 0.05 (*) Scale bars: 60 μm. |
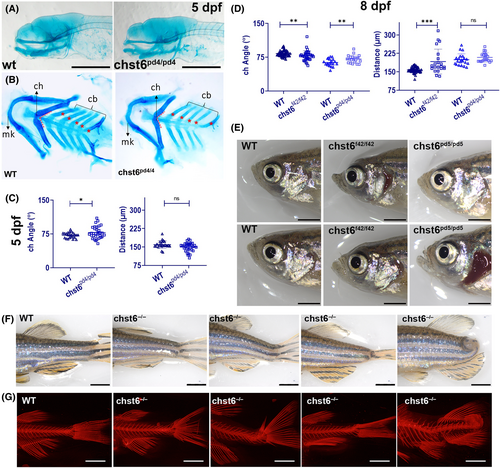
Skeletal defects in chst6 mutant zebrafish. (A–D) Alcian blue staining reveals defect in the lower jaw cartilage. (A) Lateral view, (B) dissected lower jaw of wt and chst6pd4/pd4 larvae. cb, ceratobranchial cartilage; ch, ceratohyal; mk, Meckel's cartilage; red dashed lines: the connecting angle of ch cartilages. (C, D) Graphs showing the angle between the ch and the distance between mk and ch joints of (C) wt (n = 23) and chst6pd4/pd4 (n = 32) 5 dpf larvae; P = 0.0494 (angle), P = 0.1444 (distance), (D) wt (n = 37) and chst6f42/f42 (n = 34); wt (n = 21), and chst6pd4/pd4 (n = 21) 8 dpf larvae. P = 0.0013 (angle, wt vs chst6f42/f42). P = 0.0053 (angle, wt vs chst6pd4/pd4). P < 0.001 (distance, wt vs chst6f42/f42). P = 0.1789 (distance, wt vs chst6pd4/pd4). Multiple t-test was used for statistical analysis, nonsignificant (ns), P < 0.05 (*), P < 0.01 (**), P < 0.001 (***). (E) Representative images of adult zebrafish with different face morphologies. (F) Representative images of adult zebrafish with different trunk phenotypes. (G) Alizarin red staining showing representative images of various skeletal phenotypes observed in mutant zebrafish. Scale bars: 300 μm (A), 2 mm (E, F). Images shown in E–G are representative images from different alleles. No correlation between certain phenotypes and alleles was observed. |
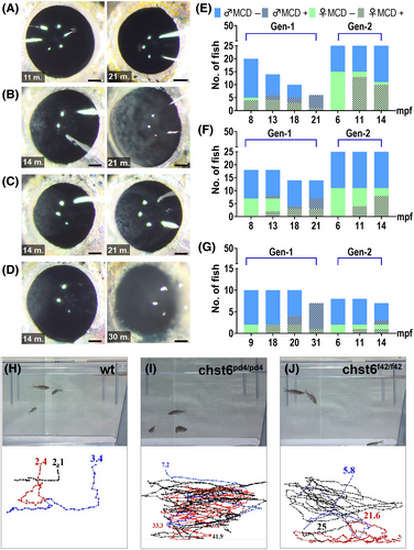
chst6 mutant zebrafish develop MCD and impaired vision. Macroscopic analysis of (A) wt, (B) chst6pd4/pd4, (C) chst6pd5/pd5, and (D) chst6f42/f42 alleles. Eyes of young (11–14 mpf) adults of gen2 (left), old (21–30 mpf) adults of gen1 (right) are shown. Scale bar: 300 μm. (E–G) Incidence of opaque corneal aggregates homozygous mutants of two generations over time (E) Green bar: females, blue bar: males, dashed bars indicate occurrence of opaque aggregates. (E) chst6pd4/pd4, (F) chst6pd5/pd5, and (G) chst6f42/f42. (H–J) The vision test was performed with wt and homozygous chst6 mutants. Swim paths and durations were tracked. Track was ended if the fish reached food and time stamp is displayed at the end of each track. (H) wt fish swam for 2.4 and 3.4 s until it reached the food (n = 3). (I) chst6pd4/pd4 swam for 33.3 and 41.9 s without noticing the food (n = 3). (J) chst6f42/f42 swam for 21.6 and 25 s without noticing the food (n = 3). PHENOTYPE:
|
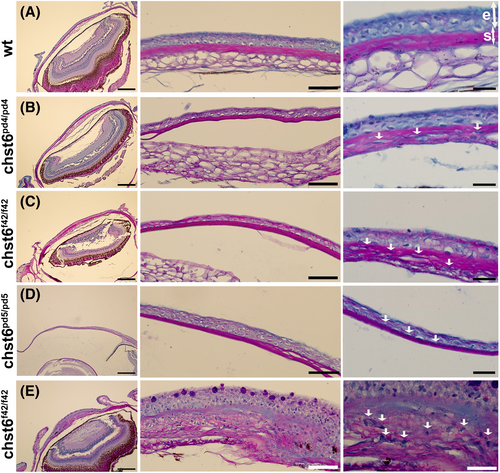
Histopathology of the corneal tissue in the mutant zebrafish. Alcian blue/periodic acid–Schiff-stained eye sections of (A) wt, (B) chst6pd4/pd4, (C) chst6f42/f42, (D) chst6pd5/pd5, and (E) chst6f42/f42 are shown (n = 7). Left column: 10× overview, scale bars: 200 μm; middle column: 40× close-up overview, scale bars: 50 μm; right column: 100× zoom, scale bars: 20 μm. Serial sections were taken from each eye, and different slices were shown in the middle and right columns. Collagen in stroma is stained pink with periodic acid–Schiff, mucopolysaccharides are stained blue with alcian blue, and nucleus is stained light purple with hematoxylin. e, epithelium; s, stroma. White arrows indicate alcian blue-positive aggregates. PHENOTYPE:
|
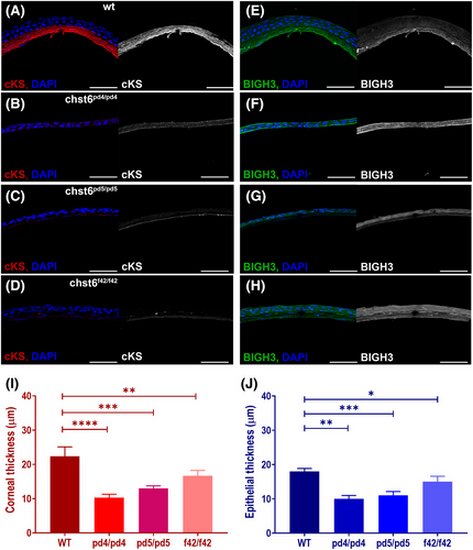
Corneal keratan sulfate (cKS) is reduced and BIGH3 expression is altered in the cornea of the adult mutant fish. Corneal sections stained with anti-cKS, anti-BIGH3, and DAPI are shown. (A) cKS (red) is detected in the corneal stroma of wt, but not detected in the mutant cornea as seen in images of (B) chst6pd4/pd4, (C) chst6pd5/pd5, (D) chst6f42/f42 mutant eye sections. Grayscale images of cKS signal are shown next to the overlay image; anti-cKS (red), DAPI (blue). (E) A strong stromal and weak epithelial BIGH3 (green) signal is detected in the cornea of the wt fish. BIGH3 is detected only in the epithelium of (F) chst6pd4/pd4 and (G) chst6pd5/pd5 mutants and (H) epithelium and stroma layers of the chst6f42/f42 mutant cornea. Scale bars: 80 μm. (I) Thickness of cornea (n = 5) and (J) corneal epithelium was measured from IF-stained cryosections represented in A–H (n = 5). Multiple t-test was used for the statistical analysis. Data are presented as the mean ± std. P < 0.05 (*), P < 0.01 (**), P < 0.001 (***), and P < 0.0001 (****) vs the wt group. |