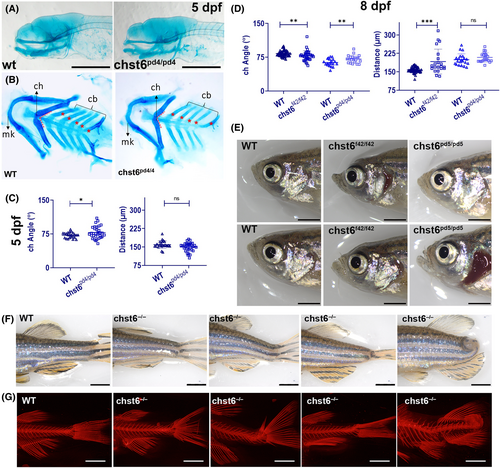
Skeletal defects in chst6 mutant zebrafish. (A–D) Alcian blue staining reveals defect in the lower jaw cartilage. (A) Lateral view, (B) dissected lower jaw of wt and chst6pd4/pd4 larvae. cb, ceratobranchial cartilage; ch, ceratohyal; mk, Meckel's cartilage; red dashed lines: the connecting angle of ch cartilages. (C, D) Graphs showing the angle between the ch and the distance between mk and ch joints of (C) wt (n = 23) and chst6pd4/pd4 (n = 32) 5 dpf larvae; P = 0.0494 (angle), P = 0.1444 (distance), (D) wt (n = 37) and chst6f42/f42 (n = 34); wt (n = 21), and chst6pd4/pd4 (n = 21) 8 dpf larvae. P = 0.0013 (angle, wt vs chst6f42/f42). P = 0.0053 (angle, wt vs chst6pd4/pd4). P < 0.001 (distance, wt vs chst6f42/f42). P = 0.1789 (distance, wt vs chst6pd4/pd4). Multiple t-test was used for statistical analysis, nonsignificant (ns), P < 0.05 (*), P < 0.01 (**), P < 0.001 (***). (E) Representative images of adult zebrafish with different face morphologies. (F) Representative images of adult zebrafish with different trunk phenotypes. (G) Alizarin red staining showing representative images of various skeletal phenotypes observed in mutant zebrafish. Scale bars: 300 μm (A), 2 mm (E, F). Images shown in E–G are representative images from different alleles. No correlation between certain phenotypes and alleles was observed.
|
