
- Title
-
Redefining retinoic acid receptor expression in zebrafish embryos using Hybridization Chain Reaction
- Authors
- Gray, R., Lovely, C.B.
- Source
- Full text @ Differentiation

Schematic of embryonic structures mentioned during the analysis of the results. The dotted line represents the distinction between structures “anterior brain” and “posterior brain” which is directly behind the otic vesicle. |

Comparison of raraa and rarab gene expression in sox17:eGFP transgenic embryos. HCR shows the expression of raraa (A, A′, B, B′, C, C′, D, D′, E, E′) and rarab (F, F′, G, G′, H, H′, I, I′, J, J′) genes from 12 hpf to 32 hpf in relation to sox17:eGFP expression. Genes raraa and rarab are co-expressed with sox17 at all time points examined. However, raraa is only co-expressed with sox17 at the tail of the embryos at time points 18 hpf and 24 hpf. A, A′, F, F’: Lateral views at 12 hpf. B, B′, G, G’: Lateral views at 16 hpf. C, C′, H, H’: Lateral views at 18 hpf. D, D′, I, I’: Lateral views of 24 hpf embryo head. E, E′,J, J’: Lateral views of 32 hpf embryo head. For all panels, green labels sox17:eGFP. For panels A–E′, magenta and grayscale images label raraa expression. For panels F–J′ magenta and grayscale images label rarab expression. Arrows indicate co-expression between sox17:eGFP and rara genes. The asterisks label the position of the otic vesicle. represent Scale Bar represents: 100um for images A-C′, F-I′ and 100um for images D-E′, I-J’. The inserts magnify the co-expression between the pharyngeal endoderm and the genes shown. EXPRESSION / LABELING:
|

Comparison of raraa and rarab gene expression in sox10:eGFP transgenic embryos. HCR shows the expression of raraa (A, A′, B, B′, C, C′, D, D′) and rarab (E, E′ F, F′, G, G′, H, H′) genes from 16 hpf to 32 hpf within sox10:GFP transgenic embryos. rarab is co-expressed with sox10 at all time points, yet raraa relatively low co-expression with sox10 at all time points. A, A′, E, E’: Lateral views at 16 hpf. B, B′, F, F’: Lateral views at 18 hpf. C, C′, G, G’: Lateral views of 24 hpf embryo head. D, D′, H, H’: Lateral views of 32 hpf embryo head. For all panels, green labels sox10:eGFP. For panels A–D′, magenta and grayscale images label raraa expression. For panels E–H′ magenta and grayscale images label rarab expression. Arrows indicate co-expression between sox10:eGFP and rara genes. The asterisks label the position of the otic vesicle. Scale Bar represents: 100um for images A-H’. The inserts magnify the co-expression between the neural crest and the genes shown. EXPRESSION / LABELING:
|
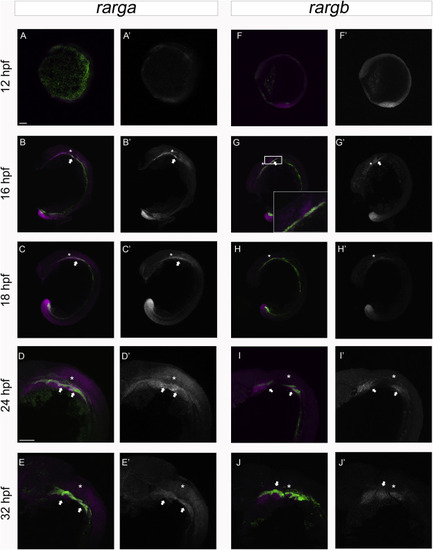
Comparison of rarga and rargb gene expression in sox17:eGFP transgenic embryos. HCR shows the expression of rarga A, A′, B, B′, C, C′, D, D′, E, E′) and rargb (F, F′, G, G′, H, H′, I, I′, J, J′) genes from 12 hpf to 32 hpf in relation to sox17:eGFP expression. rarga and rargb are co-expressed with sox17 at all time points examined. A, A′, F, F’: Lateral views at 12 hpf. B, B′, G, G’: Lateral views at 16 hpf. C, C′, H, H’: Lateral views at 18 hpf. D, D′, I, I’: Lateral views of 24 hpf embryo head. E, E′,J, J’: Lateral views of 32 hpf embryo head. For all panels, green labels sox17:eGFP. For panels A–E′, magenta and grayscale images label rarga expression. For panels F–J′ magenta and grayscale images label rargb expression. Arrows indicate co-expression between sox17:eGFP and rarg genes. The asterisks label the position of the otic vesicle. Scale Bar represents: 100um for images A-C′, F-I′ and 100um for images D-E′, I-J’. The inserts magnify the co-expression between the pharyngeal endoderm and the genes shown. EXPRESSION / LABELING:
|
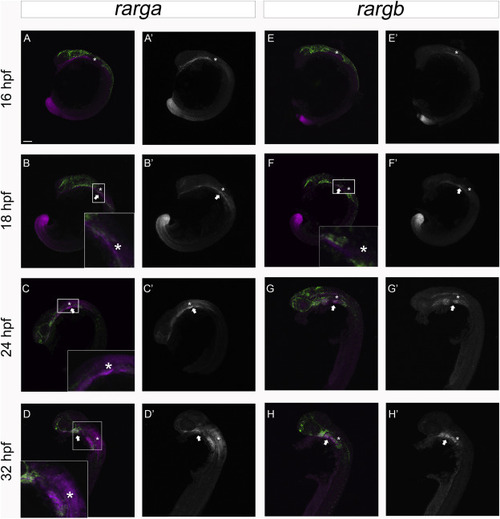
Comparison of rarga and rargb gene expression in sox10:eGFP transgenic embryos. HCR shows the expression of rarga (A, A′, B, B′, C, C′, D, D′) and rargb (E, E′ F, F′, G, G′, H, H′) genes from 16 hpf to 32 hpf within sox10:GFP transgenic embryos. rarga is co-expressed with sox10 at all time points whereas rargb had relatively low co-expression at 18 hpf, 24 hpf and 32 hpf. A, A′, E, E’: Lateral views at 16 hpf. B, B′, F, F’: Lateral views at 18 hpf. C, C′, G, G’: Lateral views of 24 hpf embryo head. D, D′, H, H’: Lateral views of 32 hpf embryo head. For all panels, green labels sox10:eGFP. For panels A–D′, magenta and grayscale images label rarga expression. For panels E–H′ magenta and grayscale images label rargb expression. Arrows indicate co-expression between sox10:eGFP and rarg genes. The asterisks label the position of the otic vesicle. Scale Bar represents: 100um for images A-H’. The inserts magnify the co-expression between the neural crest and the genes shown. EXPRESSION / LABELING:
|

Comparison of rxraa and rxrab gene expression in sox17:eGFP transgenic embryos. HCR shows the expression of rxraa (A, A′, B, B′, C, C′, D, D′, E, E′) and rxrab (F, F′, G, G′, H, H′, I, I′, J, J′) genes from 12 hpf to 32 hpf in relation to sox17:eGFP expression. rxraa and rxrab co-expressed with sox17 at all time points examined. A, A′, F, F’: Lateral views at 12 hpf. B, B′, G, G’: Lateral views at 16 hpf. C, C′, H, H’: Lateral views at 18 hpf. D, D′, I, I’: Lateral views of 24 hpf embryo head. E, E′,J, J’: Lateral views of 32 hpf embryo head. For all panels, green labels sox17:eGFP. For panels A–E′, magenta and grayscale images label rxraa expression. For panels F–J′ magenta and grayscale images label rxrab expression. Arrows indicate co-expression between sox17:eGFP and rxra genes. The asterisks label the position of the otic vesicle. Scale Bar represents: 100um for images A-C′, F-I′ and 100um for images D-E′, I-J’. The inserts magnify the co-expression between the pharyngeal endoderm and the genes shown. EXPRESSION / LABELING:
|
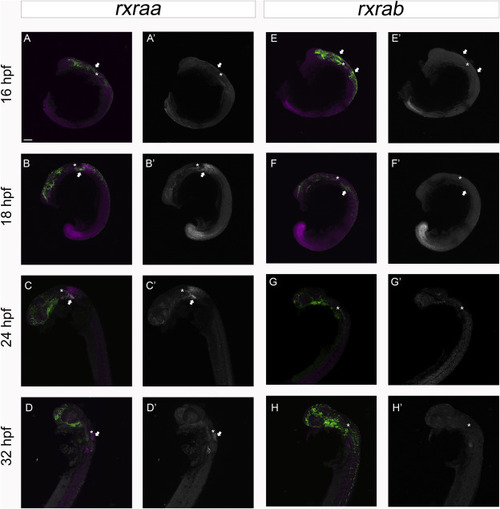
Comparison of rxraa and rxrab gene expression in and sox10:eGFP transgenic embryos. HCR shows the expression of rxraa (A, A′, B, B′, C, C′, D, D′) and rxrab (E, E′ F, F′, G, G′, H, H′) genes from 16 hpf to 32 hpf within sox10:GFP transgenic embryos. rxraa is co-expressed with sox10 at all time points, however rxrab had low co-expression at 24 hpf and 32 hpf. A, A′, E, E’: Lateral views at 16 hpf. B, B′, F, F’: Lateral views at 18 hpf. C, C′, G, G’: Lateral views of 24 hpf embryo head. D, D′, H, H’: Lateral views of 32 hpf embryo head. For all panels, green labels sox10:eGFP. For panels A–D′, magenta and grayscale images label rxraa expression. For panels E–H′ magenta and grayscale images label rxrab expression. Arrows indicate co-expression between sox10:eGFP and rxra genes. The asterisks label the position of the otic vesicle. Scale Bar represents: 100um for images A-H’. The inserts magnify the co-expression between the neural crest and the genes shown. EXPRESSION / LABELING:
|

Comparison of rxrba and rxrbb gene expression in sox17:eGFP transgenic embryos. HCR shows the expression of raraa (A, A′, B, B′, C, C′, D, D′, E, E′) and rarab (F, F′, G, G′, H, H′, I, I′, J, J′) genes from 12 hpf to 32 hpf in relation to sox17:eGFP expression. Both rxrba and rxrbb are highly expressed throughout the whole embryo. A, A′, F, F’: Lateral views at 12 hpf. B, B′, G, G’: Lateral views at 16 hpf. C, C′, H, H’: Lateral views at 18 hpf. D, D′, I, I’: Lateral views of 24 hpf embryo head. E, E′,J, J’: Lateral views of 32 hpf embryo head. For all panels, green labels sox17:eGFP. For panels A–E′, magenta and grayscale images label rxrba expression. For panels F–J′ magenta and grayscale images label rxrbb expression. Arrows indicate co-expression between sox17:eGFP and rxrb genes. The asterisks label the position of the otic vesicle. Scale Bar represents: 100um for images A-C′, F-I′ and 100um for images D-E′, I-J’. The inserts magnify the co-expression between the pharyngeal endoderm and the genes shown. EXPRESSION / LABELING:
|

Comparison of rxrba and rxrbb gene expression in and sox10:eGFP transgenic embryos. HCR shows the expression of rxraa (A, A′, B, B′, C, C′, D, D′) and rxrab (E, E′ F, F′, G, G′, H, H′) genes from 16 hpf to 32 hpf within sox10:GFP transgenic embryos. Both rxrba and rxrbb are highly expressed throughout the whole embryo. A, A′, E, E’: Lateral views at 16 hpf. B, B′, F, F’: Lateral views at 18 hpf. C, C′, G, G’: Lateral views of 24 hpf embryo head. D, D′, H, H’: Lateral views of 32 hpf embryo head. For all panels, green labels sox10:eGFP. For panels A–D′, magenta and grayscale images label rxrba expression. For panels E–H′ magenta and grayscale images label rxrbb expression Arrows indicate co-expression between sox10:eGFP and rxrb genes. The asterisks label the position of the otic vesicle. Scale Bar represents: 100um for images A-H’. The inserts magnify the co-expression between the neural crest and the genes shown. EXPRESSION / LABELING:
|

Comparison of rxrga and rxrgb gene expression in sox17:eGFP transgenic embryos. HCR shows the expression of rxraa (A, A′, B, B′, C, C′, D, D′, E, E′) and rxrab (F, F′, G, G′, H, H′, I, I′, J, J′) genes from 12 hpf to 32 hpf in relation to sox17:eGFP expression. At 12 hpf,16 hpf and 32 hpf, there was little to no co-expression of rxrga with sox17. rxrgb is co-expressed with sox17 at all time points examined. A, A′, F, F’: Lateral views at 12 hpf. B, B′, G, G’: Lateral views at 16 hpf. C, C′, H, H’: Lateral views at 18 hpf. D, D′, I, I’: Lateral views of 24 hpf embryo head. E, E′,J, J’: Lateral views of 32 hpf embryo head. For all panels, green labels sox17:eGFP. For panels A–E′, magenta and grayscale images label rxrga expression. For panels F–J′ magenta and grayscale images label rxrgb expression. Arrows indicate co-expression between sox17:eGFP and rxrg genes. The asterisks label the position of the otic vesicle. Scale Bar represents: 100um for images A-C′, F-I′ and 100um for images D-E′, I-J’. The inserts magnify the co-expression between the pharyngeal endoderm and the genes shown. EXPRESSION / LABELING:
|

Comparison of rxrga and rxrgb gene expression in sox10:eGFP transgenic embryos. HCR shows the expression of rxrga (A, A′, B, B′, C, C′, D, D′) and rxrgb (E, E′ F, F′, G, G′, H, H′) genes from 16 hpf to 32 hpf within sox10:GFP transgenic embryos. rxrga had relatively low co-expression with sox10 at all time points whereas rxrgb had low co-expression at 18 hpf, 24 hpf and 32 hpf. A, A′, E, E’: Lateral views at 16 hpf. B, B′, F, F’: Lateral views at 18 hpf. C, C′, G, G’: Lateral views of 24 hpf embryo head. D, D′, H, H’: Lateral views of 32 hpf embryo head. For all panels, green labels sox10:eGFP. For panels A–D′, magenta and grayscale images label rxrga expression. For panels E–H′ magenta and grayscale images label rxrgb expression Arrows indicate co-expression between sox10:eGFP and rxrg genes. The asterisks label the position of the otic vesicle. Scale Bar represents: 100um for images A-H’. The inserts magnify the co-expression between the neural crest and the genes shown. EXPRESSION / LABELING:
|
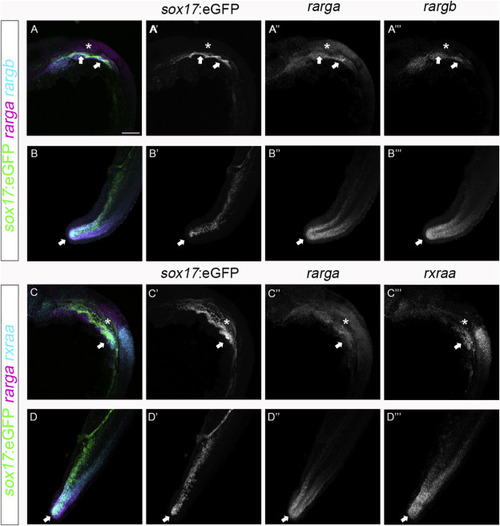
Comparison of rarga/rargb and rarga/rxraa gene expression in sox17:eGFP transgenic embryo. HCR shows the expression of rarga and rargb (A, A″, A‴, B, B″, B‴) and rarga/rxraa (C, C″, C‴, D, D″, D‴) genes at 24 hpf in relation to sox17:eGFP expression. At 24 hpf, both rarga and rargb have co-expression with sox17 within the pharyngeal endoderm and tail bud. rarga and rxraa are co-expression with sox17 within the pharyngeal endoderm and tail bud at 24 hpf. A-D‴: For panels A, A′, B, B′, C, C′, D, and D′, green and grayscale labels sox17:eGFP. For panels A, A″, B, B″, C, C″, D, and D″, magenta and grayscale label rarga expression. For panels A, A‴, B, and B‴, cyan and grayscale label rargb expression. For panels C, C‴, D, and D‴, cyan and grayscale label rxraa expression. Lateral views at 24 hpf. Arrows indicate co-expression between sox17:eGFP, rarga and either rargb (A-B‴) or rxraa (C-D‴) genes. The asterisks label the position of the otic vesicle. Scale Bar represents: 100um for images A-D‴. EXPRESSION / LABELING:
|