
|
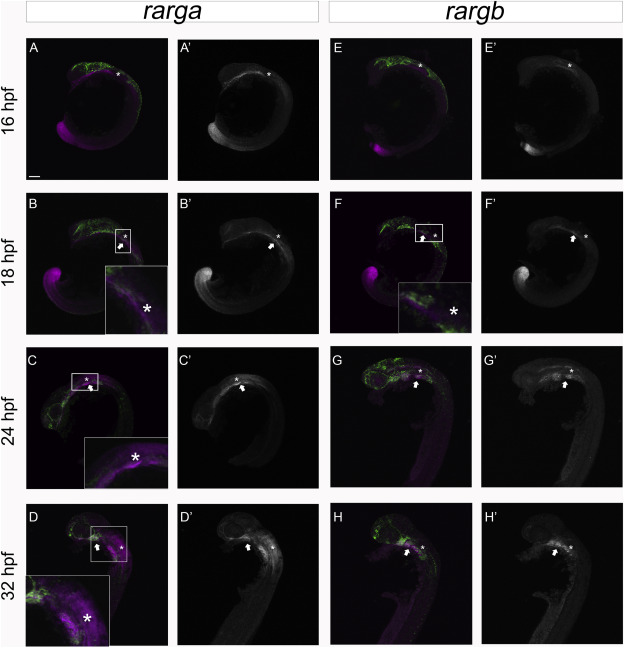
Fig. 5 Comparison of rarga and rargb gene expression in sox10:eGFP transgenic embryos. HCR shows the expression of rarga (A, A′, B, B′, C, C′, D, D′) and rargb (E, E′ F, F′, G, G′, H, H′) genes from 16 hpf to 32 hpf within sox10:GFP transgenic embryos. rarga is co-expressed with sox10 at all time points whereas rargb had relatively low co-expression at 18 hpf, 24 hpf and 32 hpf. A, A′, E, E’: Lateral views at 16 hpf. B, B′, F, F’: Lateral views at 18 hpf. C, C′, G, G’: Lateral views of 24 hpf embryo head. D, D′, H, H’: Lateral views of 32 hpf embryo head. For all panels, green labels sox10:eGFP. For panels A–D′, magenta and grayscale images label rarga expression. For panels E–H′ magenta and grayscale images label rargb expression. Arrows indicate co-expression between sox10:eGFP and rarg genes. The asterisks label the position of the otic vesicle. Scale Bar represents: 100um for images A-H’. The inserts magnify the co-expression between the neural crest and the genes shown.