
|
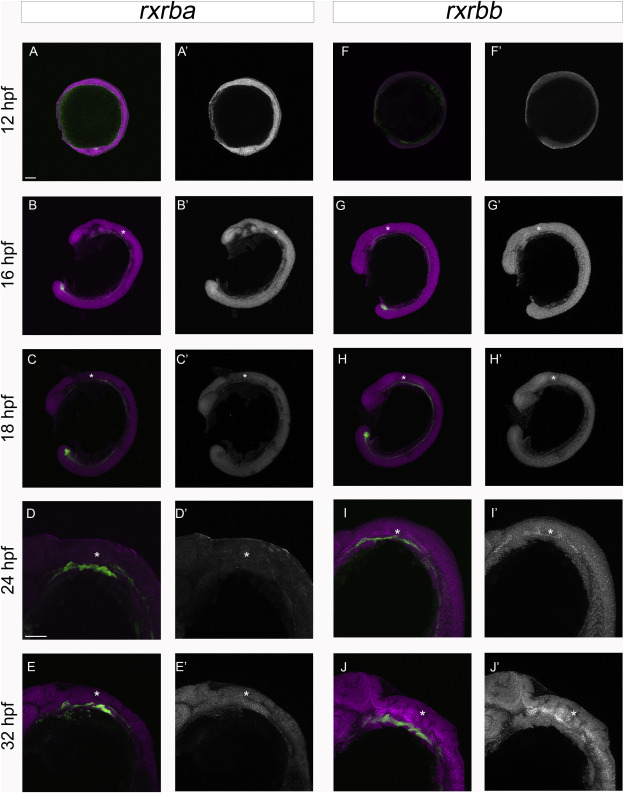
Fig. 8 Comparison of rxrba and rxrbb gene expression in sox17:eGFP transgenic embryos. HCR shows the expression of raraa (A, A′, B, B′, C, C′, D, D′, E, E′) and rarab (F, F′, G, G′, H, H′, I, I′, J, J′) genes from 12 hpf to 32 hpf in relation to sox17:eGFP expression. Both rxrba and rxrbb are highly expressed throughout the whole embryo. A, A′, F, F’: Lateral views at 12 hpf. B, B′, G, G’: Lateral views at 16 hpf. C, C′, H, H’: Lateral views at 18 hpf. D, D′, I, I’: Lateral views of 24 hpf embryo head. E, E′,J, J’: Lateral views of 32 hpf embryo head. For all panels, green labels sox17:eGFP. For panels A–E′, magenta and grayscale images label rxrba expression. For panels F–J′ magenta and grayscale images label rxrbb expression. Arrows indicate co-expression between sox17:eGFP and rxrb genes. The asterisks label the position of the otic vesicle. Scale Bar represents: 100um for images A-C′, F-I′ and 100um for images D-E′, I-J’. The inserts magnify the co-expression between the pharyngeal endoderm and the genes shown.