
- Title
-
Extremely low-frequency electromagnetic fields facilitate both osteoblast and osteoclast activity through Wnt/β-catenin signaling in the zebrafish scale
- Authors
- Kobayashi-Sun, J., Kobayashi, I., Kashima, M., Hirayama, J., Kakikawa, M., Yamada, S., Suzuki, N.
- Source
- Full text @ Front Cell Dev Biol
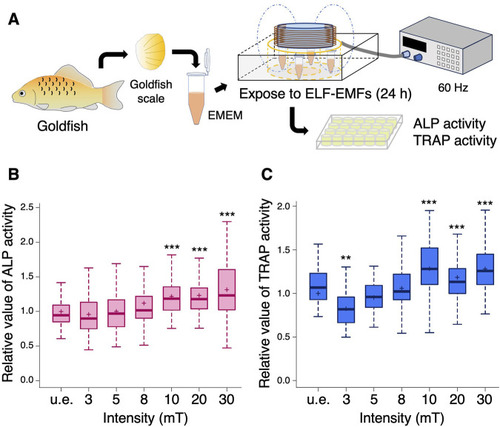
Both ALP and TRAP activity increase upon exposure to more than 10 mT of ELF-EMFs in the goldfish scale. |
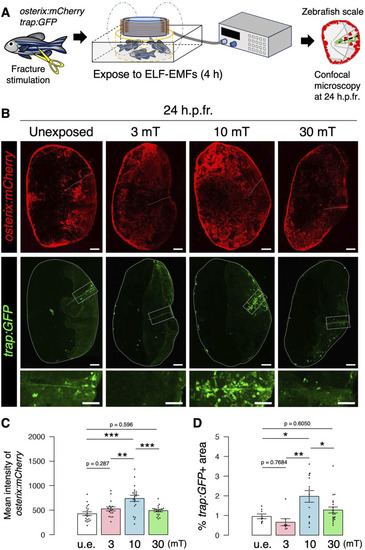
Both osteoblast and osteoclast activity increase upon exposure to 10 mT of ELF-EMFs in the zebrafish fractured scale. |
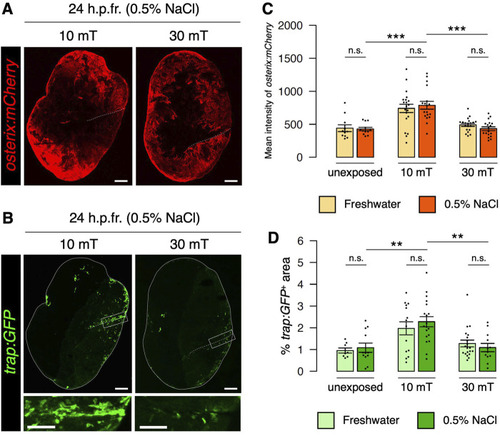
Eddy currents generated outside the body have no effect on osteoblast or osteoclast activity. |
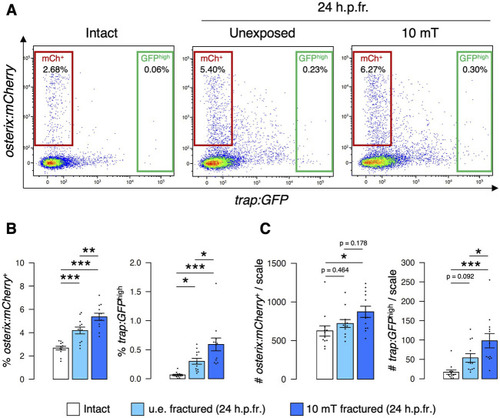
Both osteoblast and osteoclast numbers increase upon exposure to 10 mT of ELF-EMFs in the fractured scale. |
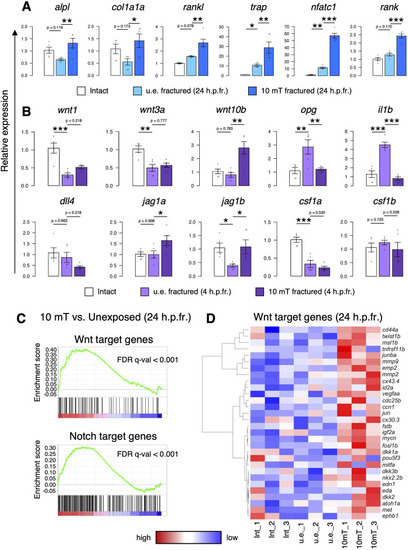
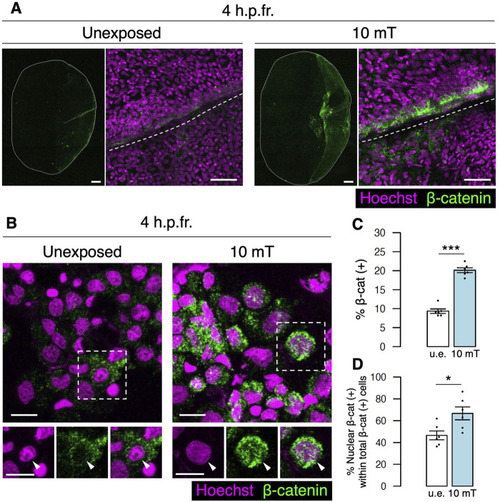
Exposure to 10 mT of ELF-EMFs enhances Wnt and Notch signaling in the fractured scale. |
Expression of |
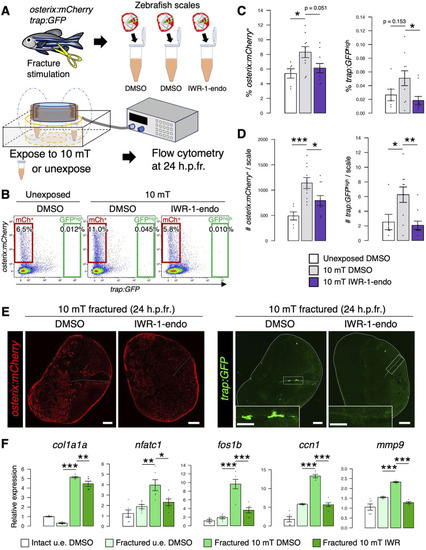
Inhibition of Wnt/ |