IMAGE

FIGURE 5

ID
ZDB-IMAGE-240222-90
Source
Figures for Kobayashi-Sun et al., 2024
Image
Figure Caption

FIGURE 5

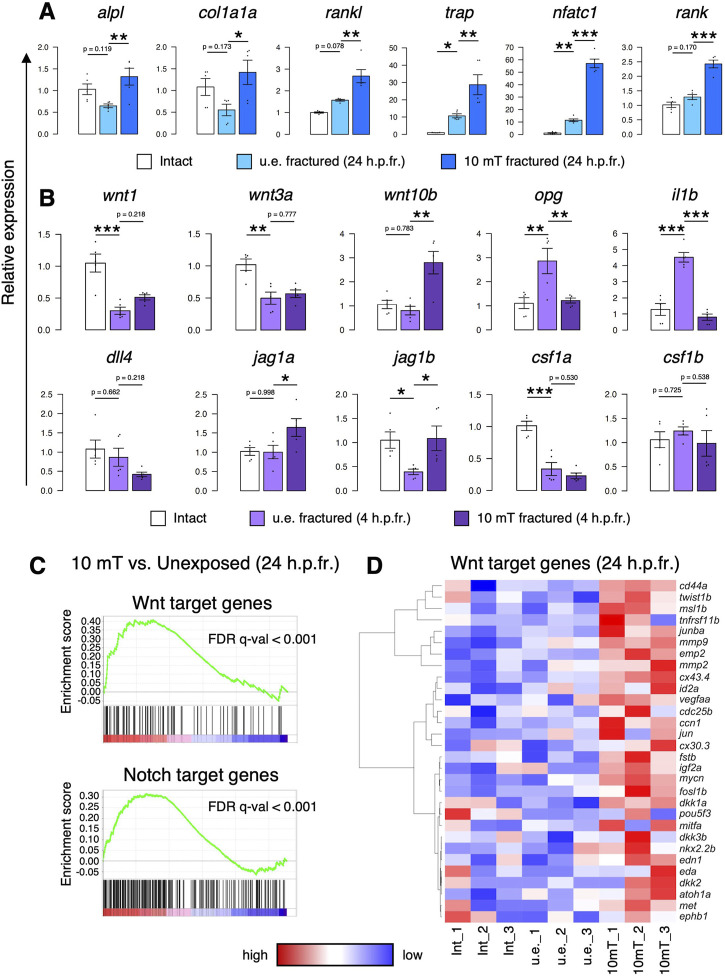
Exposure to 10 mT of ELF-EMFs enhances Wnt and Notch signaling in the fractured scale. (A,B) Relative gene expression of osteoblast markers (alpl, col1a1a, and rankl) and osteoclast markers (trap, nfatc, and rank) in intact scales, unexposed fractured scales (u.e. fractured), or fractured scales exposed 10 mT ELF-EMFs (10 mT fractured) at 24 h.p.fr. (A) and signaling molecules for osteoblasts and/or osteoclasts in intact scales, u.e. fractured scales, or 10 mT fractured scales at 4 h.p.fr. (B). Relative expression levels were calculated by ΔΔCt method with the reference gene of ef1a. Asterisks indicate the p-value in one-way ANOVA with Dunnett’s test. Error bars, s.e.m. (n = 5 for each). *p < 0.05, **p < 0.01, ***p < 0.001. (C) Gene set enrichment analysis (GSEA) of Wnt target genes (upper panel) and Notch target genes (lower panel) in fractured scales unexposed or exposed to 10 mT ELF-EMFs at 24 h.p.fr. (n = 3 for each) (D) Hierarchical clustering of selected Wnt target genes in intact scales (Int_1–3), u.e. fractured scales (u.e._1–3), or 10 mT fractured scales (10 mT_1–3) at 24 h.p.fr. (n = 3 for each).

Acknowledgments
This image is the copyrighted work of the attributed author or publisher, and ZFIN has permission only to display this image to its users. Additional permissions should be obtained from the applicable author or publisher of the image. Full text @ Front Cell Dev Biol