IMAGE

FIGURE 2

ID
ZDB-IMAGE-240222-85
Source
Figures for Kobayashi-Sun et al., 2024
Image
Figure Caption

FIGURE 2

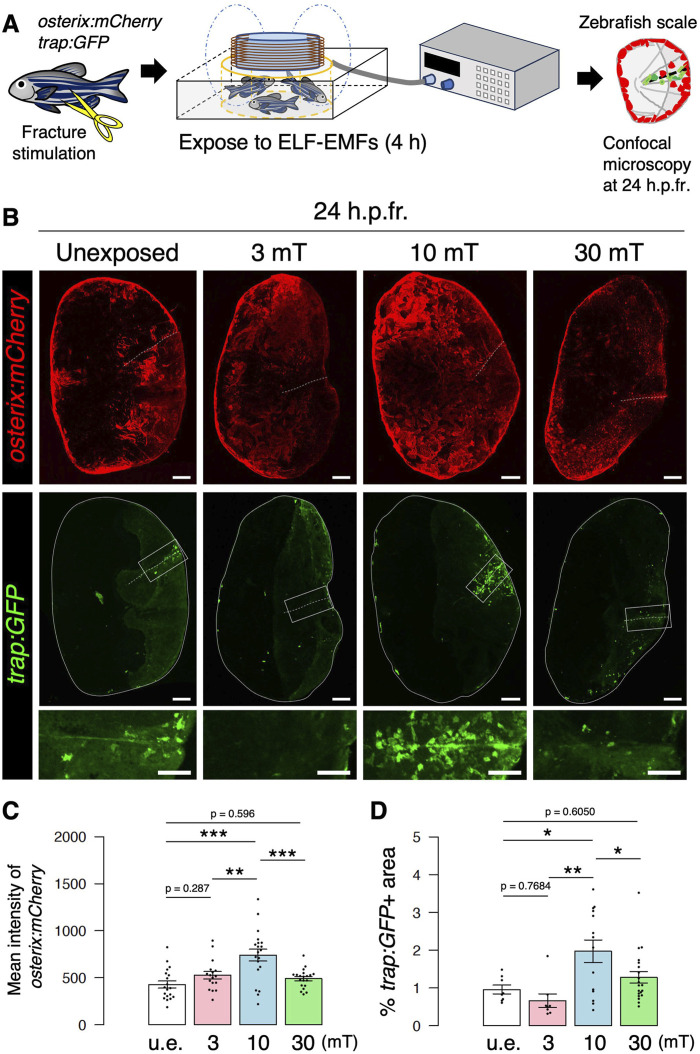
Both osteoblast and osteoclast activity increase upon exposure to 10 mT of ELF-EMFs in the zebrafish fractured scale. (A) Schematic diagram of the experimental method. After fracture stimulation, zebrafish were placed in a ring-shaped tank and unexposed (u.e.) or exposed to ELF-EMFs with varying intensities (3, 10, or 30 mT) for 4 h, followed by imaging of zebrafish scales by confocal microscopy. (B) Representative images of fractured scales in osterix:mCherry; trap:GFP double-transgenic zebrafish unexposed or exposed to ELF-EMFs at 24 h.p.fr. White dotted lines and solid lines indicate the fracture site and contour of the zebrafish scale, respectively. Lower panels of trap:GFP show a high magnification view of the fracture site (boxed region). Bars, 200 μm (osterix:mCherry and upper panels of trap:GFP); 100 μm (lower panels of trap:GFP). (C,D) Mean fluorescent intensity of osterix:mCherry per zebrafish scale and percentage of trap:GFP+ area (coverage area) per zebrafish scale in fractured scales from zebrafish unexposed or exposed to ELF-EMFs. A total of 17–20 scales from 3 zebrafish were used in each condition. Asterisks indicate the p-value in one-way ANOVA with Dunnett’s test. Error bars, s.e.m.; *p < 0.05, **p < 0.01, ***p < 0.001.

Acknowledgments
This image is the copyrighted work of the attributed author or publisher, and ZFIN has permission only to display this image to its users. Additional permissions should be obtained from the applicable author or publisher of the image. Full text @ Front Cell Dev Biol