IMAGE

FIGURE 1

ID
ZDB-IMAGE-240222-84
Source
Figures for Kobayashi-Sun et al., 2024
Image
Figure Caption

FIGURE 1

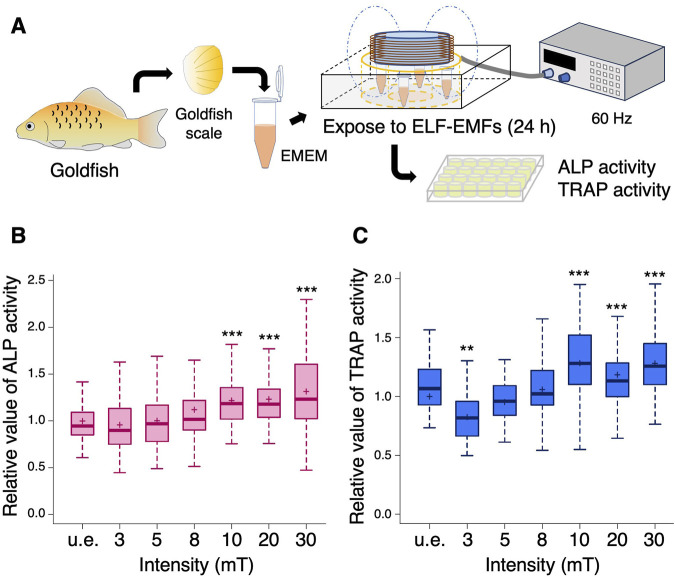
Both ALP and TRAP activity increase upon exposure to more than 10 mT of ELF-EMFs in the goldfish scale. (A) Schematic diagram of the experimental method. Extracted goldfish scales were unexposed (u.e.) or exposed to ELF-EMFs at varying intensities (3, 5, 8, 10, 20, or 30 mT) for 24 h, followed by measurement of ALP or TRAP activity in each goldfish scale. (B,C) Boxplots show the relative values of ALP (B) and TRAP activity (C) with the mean value in the u.e. scale as 1. “+” within the boxplot denotes the mean value. A total of 56–100 goldfish scales from 7 to 10 goldfish were used in each condition. Asterisks indicate the p-value in one-way ANOVA with Dunnett’s test vs. u.e. group. **p < 0.01, ***p < 0.001.

Acknowledgments
This image is the copyrighted work of the attributed author or publisher, and ZFIN has permission only to display this image to its users. Additional permissions should be obtained from the applicable author or publisher of the image. Full text @ Front Cell Dev Biol