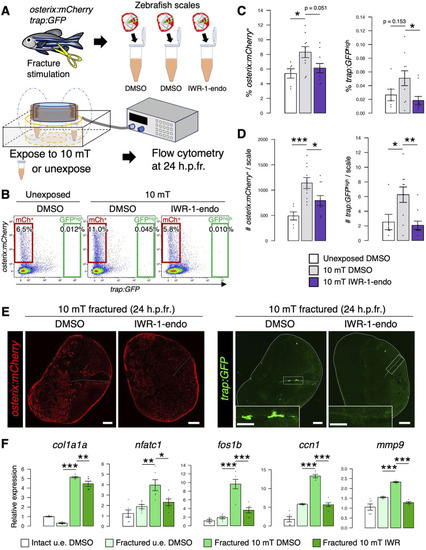
Inhibition of Wnt/β-catenin signaling reduces both osteoblasts and osteoclasts in the ELF-EMF exposed scale. (A) Schematic diagram of the experimental method. After fracture stimulation, zebrafish scales were extracted, placed in a tube containing conditioned medium supplemented with DMSO or IWR-1-endo (20 μM), and unexposed or exposed to 10 mT ELF-EMFs for 4 h. Cells were then collected from the zebrafish scales at 24 h.p.fr. and analyzed by flow cytometry. (B) Representative results of flow cytometric analysis of cells from fractured scales unexposed or exposed to 10 mT ELF-EMFs in the presence of DMSO or IWR-1-endo at 24 h.p.fr. Red and green gates show trap:GFP–osterix:mCherry+ (“mCh+”) and trap:GFPhigh (“GFPhigh”) cells, respectively. (C,D) Percentage (C) and absolute number of mCh+ and GFPhigh cells per zebrafish scale (D) in fractured scales unexposed or exposed to 10 mT ELF-EMFs in the presence of DMSO or IWR-1-endo. A total of 10 samples from 5 zebrafish were used in each condition. Asterisks indicate the p-value in one-way ANOVA with Dunnett’s test. Error bars, s.e.m. (E) Representative images of fractured scales in osterix:mCherry; trap:GFP double-transgenic zebrafish exposed to 10 mT ELF-EMFs in the presence of DMSO or IWR-1-endo at 24 h.p.fr. White dotted lines and solid lines indicate the fracture site and contour of the zebrafish scale, respectively. Insets of trap:GFP show a high magnification view of the fracture site (boxed region). Bars, 200 μm (osterix:mCherry and trap:GFP); 100 μm (insets of trap:GFP). (F) Relative gene expression of an osteoblast marker (col1a1a), osteoclast marker (nfatc), and Wnt target genes (fos1b, ccn1, and mmp9) in the intact DMSO-treated, unexposed fractured DMSO-treated, 10 mT fractured DMSO-treated, and 10 mT fractured IWR-1-endo-treated scale at 24 h.p.fr. Asterisks indicate the p-value in one-way ANOVA with Dunnett’s test. Error bars, s.e.m. (n = 6 for each). *p < 0.05, **p < 0.01, ***p < 0.001.
|
