FIGURE SUMMARY
Title

Unique activities of two overlapping PAX6 retinal enhancers

Authors
Uttley, K., Papanastasiou, A.S., Lahne, M., Brisbane, J.M., MacDonald, R.B., Bickmore, W.A., Bhatia, S.
Source
Full text @ Life Sci Alliance

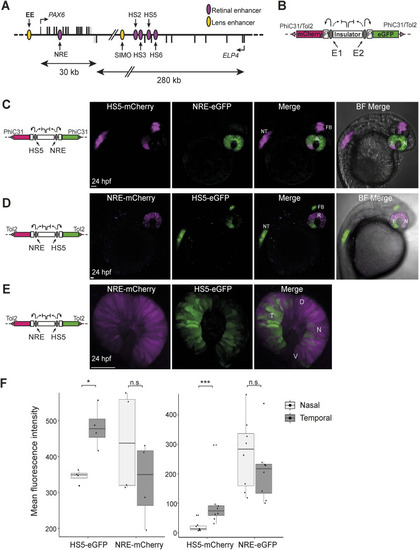
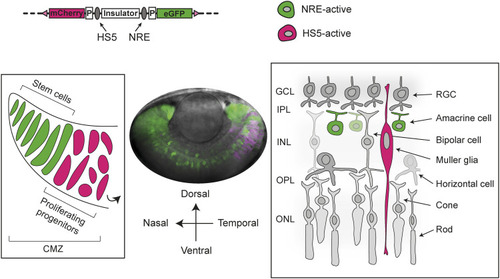
Activity of HS5 and NRE in a dual enhancer–reporter system during zebrafish embryonic development.

(A) Map of human PAX6 regulatory locus showing the position of eye enhancers including HS5 and NRE (retinal, purple; lens, yellow). (B) Dual enhancer–reporter injection construct. mCherry and eGFP are transcribed from a minimal gata2 promoter (P) activated by enhancer E1 or E2. An insulator based on the chicken HS4 sequence separates the enhancers. Targeted PhiC31 integration or random Tol2 integration is used to insert the dual-reporter construct into the zebrafish genome (Bhatia et al, 2021). (C) Live imaging of a 24-hpf NRE-eGFP/HS5-mCherry F1 embryo (10x objective). NRE (eGFP) is active throughout the retina (R). HS5 (mCherry) is active in the forebrain (FB), neural tube (NT), and in the retina where activity is highest in the temporal (T) half of the retina, compared with the nasal (N) side. (D) Live imaging of a 24-hpf NRE-mCherry/HS5-eGFP F1 embryo showing the activity of HS5 (eGFP) in FB, NT, and predominantly the temporal retina, towards the ventral (V) side as opposed to dorsal (D). NRE (mCherry) is active throughout the retina (10x objective); (E, D) as in (D), but at higher resolution (40x water immersion objective). Scale bars 50 μm. (F) Quantification of mean fluorescence intensity for mCherry and eGFP in the nasal versus temporal retina at 24 hpf in NRE-mCherry/HS5-eGFP (left) and NRE-eGFP/HS5-mCherry (right) F1 embryos. The activity of HS5 (eGFP or mCherry) is significantly higher in the temporal retina. n F1 embryos imaged ≥4. Wilcoxon test results: ns, not significant; *, P < 0.05; ***, P < 0.001. Scale bars 50 μm.

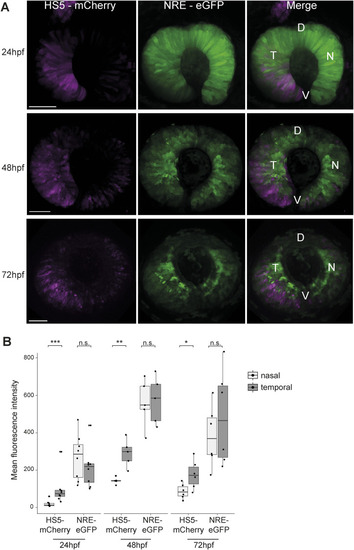
HS5 and NRE are active in different zones of the developing retina.

(A) Live imaging at 24, 48, and 72 hpf in the developing retina of NRE-eGFP/HS5-mCherry F1 embryos. D, dorsal; V, ventral; T, temporal; N, nasal. Scale bars 50 μm. (B) Quantification of mean fluorescence intensity for mCherry (HS5) and eGFP (NRE) in the nasal versus temporal retina at 24, 48, and 72 hpf. Each measurement represents one embryo. The activity of HS5 (mCherry signal) is significantly higher in the temporal retina at all time points. n F1 embryos imaged ≥6 for all time points. Wilcoxon test results: ns, not significant; *, P < 0.05; **, P < 0.01; ***, P < 0.001.

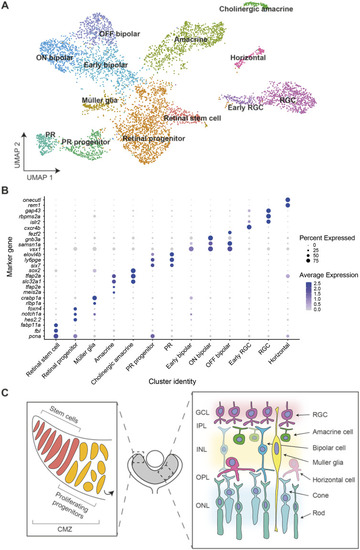
Single-cell RNA sequencing of NRE-eGFP/HS5-mCherry retinal cells at 48 hpf.

(A) Cells from six sequenced libraries of NRE-eGFP/HS5-mCherry F1 embryos at 48 hpf, merged into one sample, and visualised on a Uniform Manifold Approximation and Projection plot created by Louvain clustering using Seurat (Butler et al, 2018). Retinal cell types are manually annotated to clusters depending on marker gene expression. (B) Dot plot showing average expression level and percentage of cells expressing key marker genes used to annotate cell-type clusters. (C) Schematic of cell types in the zebrafish retina. In the ciliary marginal zone, retinal stem cells undergo asymmetrical division to give rise to a rapidly proliferating pool of retinal progenitor cells (left), which divide and differentiate to form cells present in the retinal layers (right) (Richardson et al, 2017; Wan et al, 2016). (A) Colours correspond to the annotated cluster cell types in (A). RGC, retinal ganglion cell; GCL, ganglion cell layer; IPL, inner plexiform layer; INL, inner nuclear layer; OPL, outer plexiform layer; ONL, outer nuclear layer.

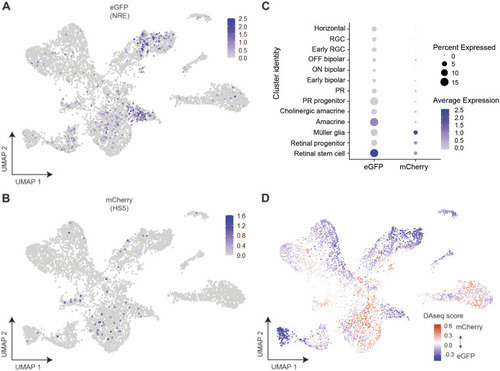
Assigning the identity of HS5 and NRE-active cells using the expression of eGFP and mCherry, and differential abundance analysis in cell-type clusters.

(A, B) Expression of eGFP and (B) mCherry in single cells visualised on UMAP plots (clustered as in Fig 3A). eGFP expression is enriched in amacrine and retinal stem cell clusters. (C) Dot plot showing average expression and percentage of cells expressing mCherry (HS5-active) and eGFP (NRE-active) in cell-type clusters. Enrichment is seen for eGFP expression in amacrine and retinal stem cell clusters, and for mCherry in Müller glia and retinal progenitor/stem cell clusters. (D) DAseq (Zhao et al, 2021) differential abundance analysis comparing the relative prevalence of cells from mCherry-enriched or eGFP-enriched samples. Cells are coloured by DAseq score and displayed on a UMAP plot. A score is calculated for each cell based on the abundance of cells from both populations in the cell’s neighbourhood. Positive (red) scores indicate an abundance of cells from mCherry-enriched samples; negative (blue) scores indicate an abundance of cells from eGFP-enriched samples.

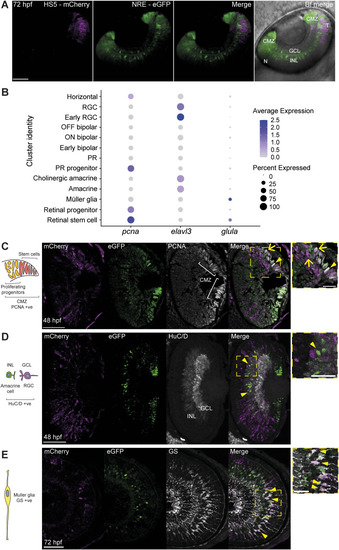
Immunofluorescence identifies enhancer-active cell types.

(A) Coronal-orientation image of a NRE-eGFP/HS5-mCherry embryo at 48 hpf showing the activity of NRE (eGFP) in the distal CMZ (stem cell niche) and cells of the INL, and HS5 (mCherry) activity in the temporal retina, in the proximal CMZ, and cells of the INL. (B) Dot plot showing average expression and percentage of cells expressing pcna, elavl3 (encoding HuC/D), and glula (encoding glutamine synthetase [GS]) in cell type clusters. (C) Immunofluorescence for PCNA, mCherry, and eGFP on a coronal eye section from an NRE-eGFP/HS5-mCherry F1 embryo at 48 hpf. PCNA is a marker for progenitors and stem cells in the CMZ. An arrow indicates an mCherry/PCNA-positive cell. An arrowhead indicates a eGFP/PCNA-positive cell. (D) As in (C), but using an antibody detecting HuC/D (elavl3/4). HuC/D is a marker for RGCs in the GCL and amacrine cells in the INL. Arrowheads indicate eGFP/HuC/D-positive cells. (E) As in (C) but using an antibody detecting GS, on an embryo at 72 hpf (sagittal section). GS is a marker for Müller glia. Arrowheads indicate mCherry/GS-positive cells. Scale bars 50 μm, 20 μm in zoom.

Investigating the distinct functions of overlapping <italic toggle='yes'>PAX6</italic> retinal enhancers in a zebrafish dual enhancer–reporter assay.

PAX6 retinal enhancers HS5 and NRE have distinct spatiotemporal and cell type-specific functions in a dual enhancer–reporter system in zebrafish embryonic development. NRE is active throughout the developing retina, and is localised to stem cells of the CMZ and amacrine cells of the INL (green). HS5 is active mainly in the temporal region of the retina, in proliferating progenitors, and Müller glia (magenta).

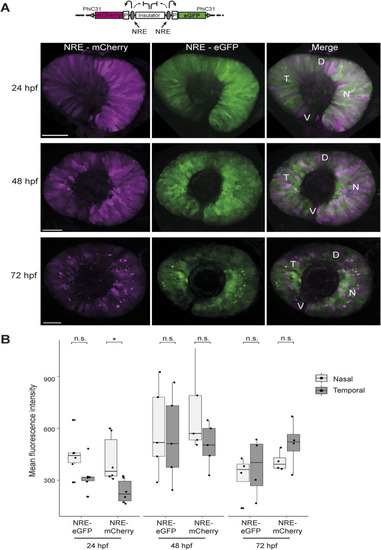
NRE control enhancer–reporter line reveals differential activity of NRE at 24 hpf.

(A) Live imaging of NRE-eGFP/NRE-mCherry F1 embryos shows overlapping retinal signal for mCherry and eGFP at 24, 48, and 72 hpf. At 72 hpf, a layer of strongly positive NRE-active cells can be seen in the neural retina. (B) Quantification of mean fluorescence intensity for mCherry and eGFP in NRE control embryos at 24, 48, and 72 hpf shows that NRE (mCherry) activity is significantly higher in the nasal retina compared with the temporal zone at 24 hpf. n F1 embryos imaged ≥5 for all time points. Wilcoxon test results: ns, not significant; *, P < 0.05. D, dorsal; V, ventral; T, temporal; N, nasal. Scale bars 50 μm.

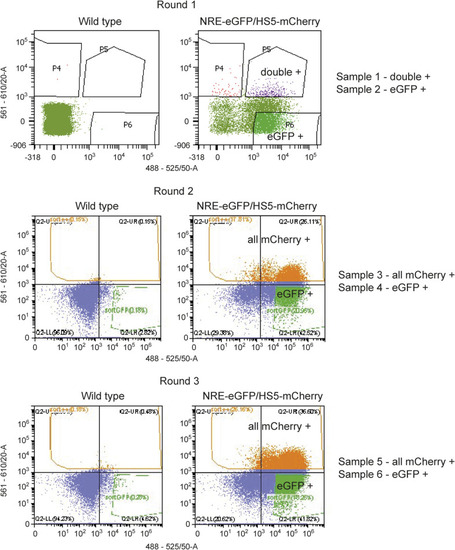
FACS profiles for scRNA-sequencing dataset.

FACS plots showing WT controls (left) and NRE-eGFP/HS5-mCherry samples (right). Samples were sorted for eGFP (x-axis) and mCherry fluorescence (y-axis). In round 1, an eGFP-+ve sample and a double-+ve sample were collected and processed for scRNA-seq. In rounds 2 and 3, an eGFP-+ve sample and a sample of all mCherry-+ve were collected and processed for scRNA-seq.

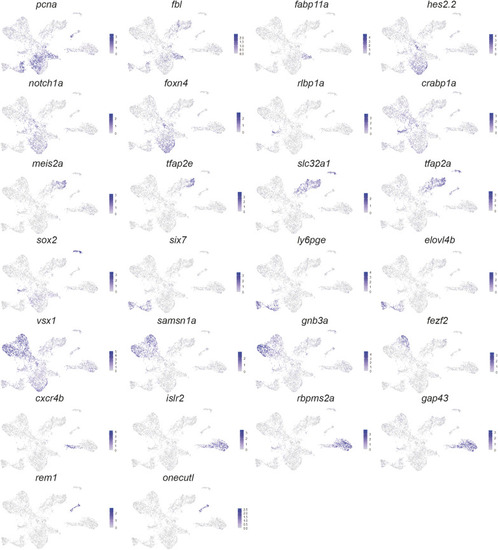
Expression of marker genes used for cluster annotation.

Expression of cluster marker genes from Fig 3B visualised on UMAP plots.

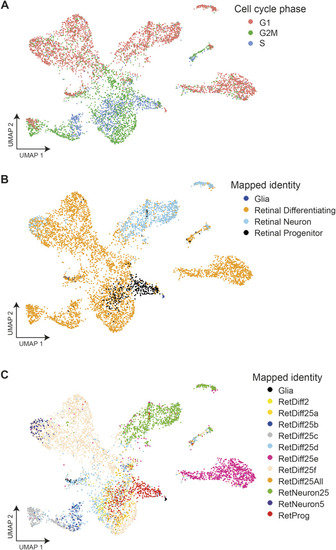
Mapped cell-type identities and assigned cell cycle phase.
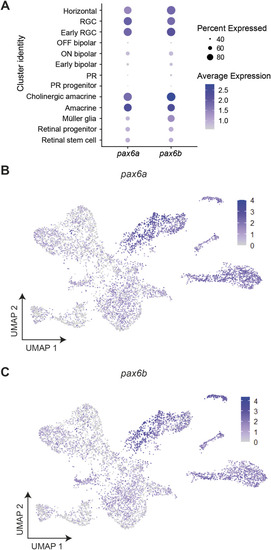
(A) Cell cycle phase assigned to cells using Seurat visualised on a UMAP plot. (B, C) Simplified identity of cells mapped to the Farnsworth et al (2019) single-cell expression zebrafish atlas (2 dpf), visualised on a UMAP plot; (C) shows actual mapped subtypes for retinal differentiating and neuron identities.

Expression of pax6a and pax6b across retinal cell types.

(A) Dot plot showing the average expression and percentage of cells expressing pax6a and pax6b in cell-type clusters. (B, C) Expression of pax6a and (C) pax6b in cells visualised on UMAP plots.

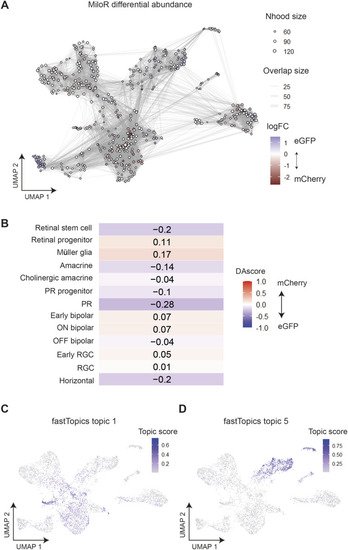
Differential abundance analysis and topic modelling validates the assignment of enhancer-active cell types.

(A) MiloR (Dann et al, 2022) differential abundance testing. MiloR groups cells into neighbourhoods (nodes), then tests for differential abundance of cells from mCherry (HS5)-enriched or eGFP (NRE)-enriched samples within each neighbourhood. Neighbourhoods are shown here on a UMAP plot coloured according to the logFC score representing the abundance of cells from eGFP-enriched samples (positive, blue) or mCherry-enriched samples (negative, red) within each neighbourhood. (B) DAseq scores per cluster. Red (positive scores) indicates enrichment of cells from mCherry samples, blue (negative scores) for cells from eGFP samples. (C) fastTopics (Dey et al, 2017) applies topic modelling to count the data. Each topic is defined by a set of genes and each cell is represented as a unique mixture of all topics. The score or “membership” of each cell to topic 1 is shown here on a UMAP plot. Topic 2 appears to score highly in cells from Müller glia and progenitor clusters. (D) As in (C) showing the scores for topic 5, which are high in amacrine cell clusters.

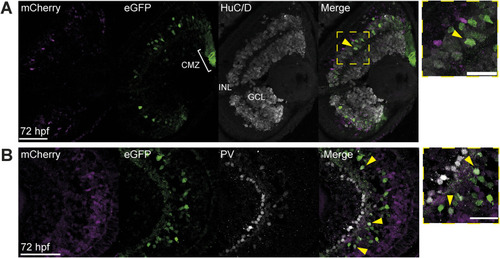
Immunofluorescence shows NRE-active amacrine cells.

(A) Immunofluorescence on eye sections for HuC/D, mCherry, and eGFP on a coronal eye section from an NRE-eGFP/HS5-mCherry F2 embryo at 72 hpf. HuC/D is a marker for RGCs in the GCL and amacrine cells in the INL. Arrowheads indicate eGFP/HuC/D-positive cells. (B) As in (A), but using an antibody detecting parvalbumin (PV), on an embryo at 72 hpf. PV is a marker for amacrine cells. Arrowheads indicate eGFP/PV-positive cells. Scale bars 50 μm in full images, 20 μm in zoom.

Acknowledgments
This image is the copyrighted work of the attributed author or publisher, and ZFIN has permission only to display this image to its users. Additional permissions should be obtained from the applicable author or publisher of the image. Full text @ Life Sci Alliance