IMAGE

Figure S1.

ID
ZDB-IMAGE-230916-124
Source
Figures for Uttley et al., 2023
Image
Figure Caption

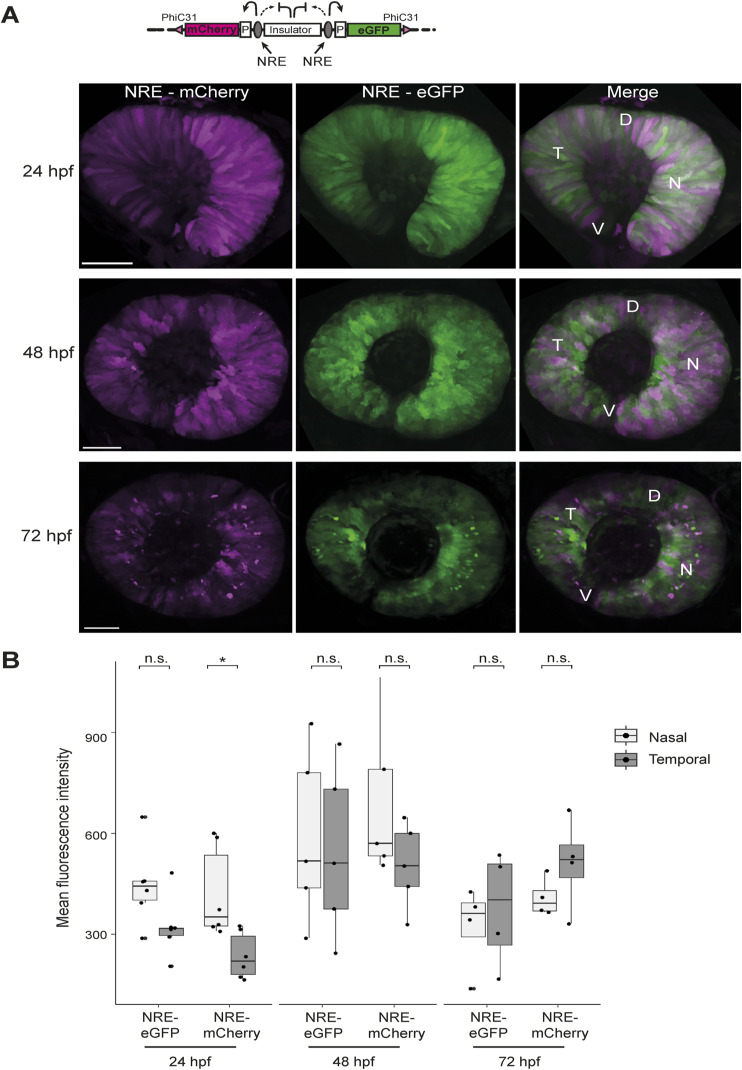
Figure S1. NRE control enhancer–reporter line reveals differential activity of NRE at 24 hpf.

(A) Live imaging of NRE-eGFP/NRE-mCherry F1 embryos shows overlapping retinal signal for mCherry and eGFP at 24, 48, and 72 hpf. At 72 hpf, a layer of strongly positive NRE-active cells can be seen in the neural retina. (B) Quantification of mean fluorescence intensity for mCherry and eGFP in NRE control embryos at 24, 48, and 72 hpf shows that NRE (mCherry) activity is significantly higher in the nasal retina compared with the temporal zone at 24 hpf. n F1 embryos imaged ≥5 for all time points. Wilcoxon test results: ns, not significant; *, P < 0.05. D, dorsal; V, ventral; T, temporal; N, nasal. Scale bars 50 μm.

Acknowledgments
This image is the copyrighted work of the attributed author or publisher, and ZFIN has permission only to display this image to its users. Additional permissions should be obtained from the applicable author or publisher of the image. Full text @ Life Sci Alliance