FIGURE

Figure 4.

ID
ZDB-FIG-230916-124
Publication
Uttley et al., 2023 - Unique activities of two overlapping PAX6 retinal enhancers
Other Figures
All Figure Page
Back to All Figure Page
Figure 4.

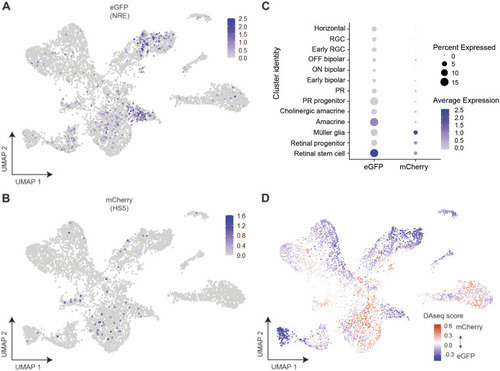
Assigning the identity of HS5 and NRE-active cells using the expression of eGFP and mCherry, and differential abundance analysis in cell-type clusters.

(A, B) Expression of eGFP and (B) mCherry in single cells visualised on UMAP plots (clustered as in Fig 3A). eGFP expression is enriched in amacrine and retinal stem cell clusters. (C) Dot plot showing average expression and percentage of cells expressing mCherry (HS5-active) and eGFP (NRE-active) in cell-type clusters. Enrichment is seen for eGFP expression in amacrine and retinal stem cell clusters, and for mCherry in Müller glia and retinal progenitor/stem cell clusters. (D) DAseq (Zhao et al, 2021) differential abundance analysis comparing the relative prevalence of cells from mCherry-enriched or eGFP-enriched samples. Cells are coloured by DAseq score and displayed on a UMAP plot. A score is calculated for each cell based on the abundance of cells from both populations in the cell’s neighbourhood. Positive (red) scores indicate an abundance of cells from mCherry-enriched samples; negative (blue) scores indicate an abundance of cells from eGFP-enriched samples.

Expression Data

Expression Detail
Antibody Labeling
Phenotype Data

Phenotype Detail
Acknowledgments
This image is the copyrighted work of the attributed author or publisher, and ZFIN has permission only to display this image to its users. Additional permissions should be obtained from the applicable author or publisher of the image. Full text @ Life Sci Alliance