|
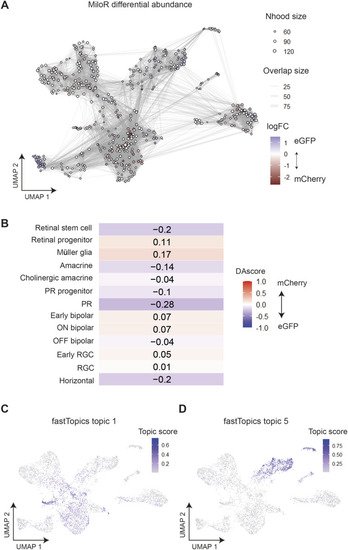
Differential abundance analysis and topic modelling validates the assignment of enhancer-active cell types. (A) MiloR (Dann et al, 2022) differential abundance testing. MiloR groups cells into neighbourhoods (nodes), then tests for differential abundance of cells from mCherry (HS5)-enriched or eGFP (NRE)-enriched samples within each neighbourhood. Neighbourhoods are shown here on a UMAP plot coloured according to the logFC score representing the abundance of cells from eGFP-enriched samples (positive, blue) or mCherry-enriched samples (negative, red) within each neighbourhood. (B) DAseq scores per cluster. Red (positive scores) indicates enrichment of cells from mCherry samples, blue (negative scores) for cells from eGFP samples. (C) fastTopics (Dey et al, 2017) applies topic modelling to count the data. Each topic is defined by a set of genes and each cell is represented as a unique mixture of all topics. The score or “membership” of each cell to topic 1 is shown here on a UMAP plot. Topic 2 appears to score highly in cells from Müller glia and progenitor clusters. (D) As in (C) showing the scores for topic 5, which are high in amacrine cell clusters.
|