IMAGE

Figure 2.

ID
ZDB-IMAGE-230916-123
Source
Figures for Uttley et al., 2023
Image
Figure Caption

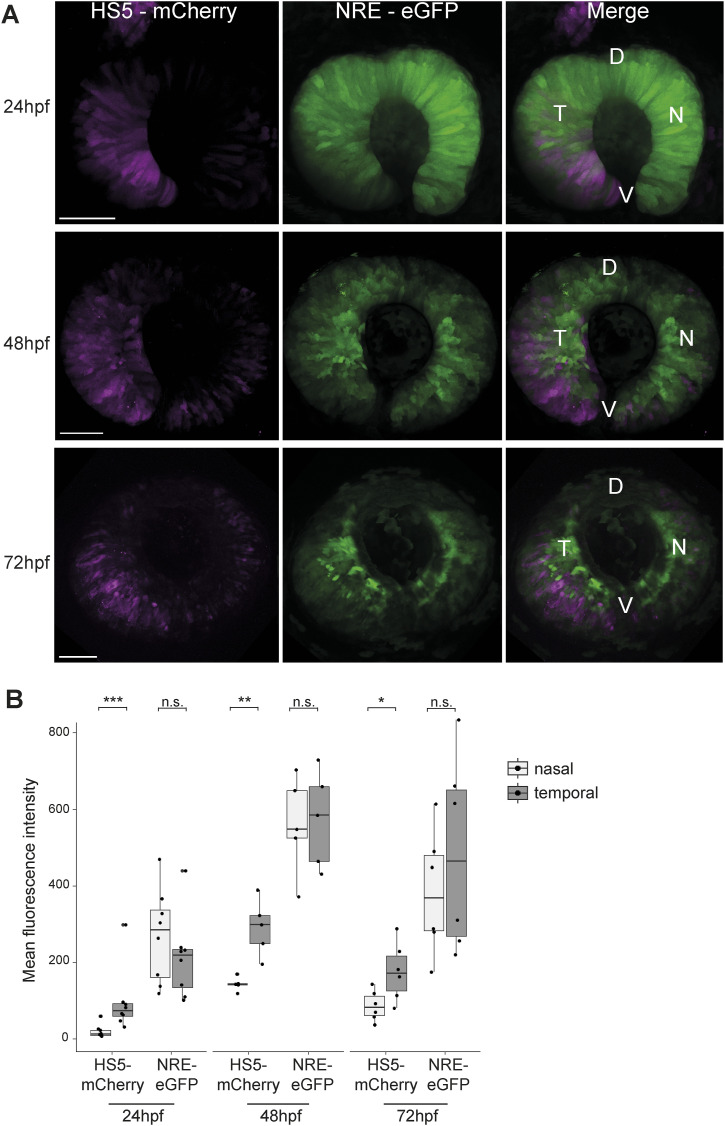
Figure 2. HS5 and NRE are active in different zones of the developing retina.

(A) Live imaging at 24, 48, and 72 hpf in the developing retina of NRE-eGFP/HS5-mCherry F1 embryos. D, dorsal; V, ventral; T, temporal; N, nasal. Scale bars 50 μm. (B) Quantification of mean fluorescence intensity for mCherry (HS5) and eGFP (NRE) in the nasal versus temporal retina at 24, 48, and 72 hpf. Each measurement represents one embryo. The activity of HS5 (mCherry signal) is significantly higher in the temporal retina at all time points. n F1 embryos imaged ≥6 for all time points. Wilcoxon test results: ns, not significant; *, P < 0.05; **, P < 0.01; ***, P < 0.001.

Acknowledgments
This image is the copyrighted work of the attributed author or publisher, and ZFIN has permission only to display this image to its users. Additional permissions should be obtained from the applicable author or publisher of the image. Full text @ Life Sci Alliance