IMAGE

Figure S4.

ID
ZDB-IMAGE-230916-128
Source
Figures for Uttley et al., 2023
Image
Figure Caption

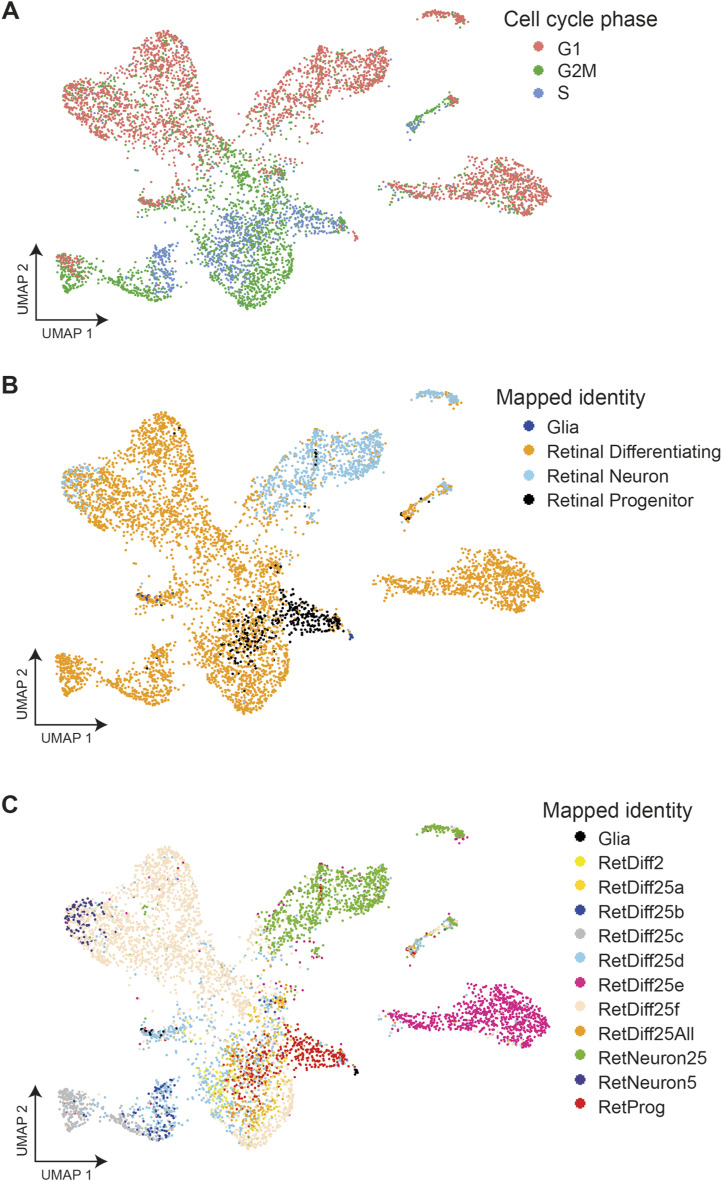
Figure S4. Mapped cell-type identities and assigned cell cycle phase.

(A) Cell cycle phase assigned to cells using Seurat visualised on a UMAP plot. (B, C) Simplified identity of cells mapped to the Farnsworth et al (2019) single-cell expression zebrafish atlas (2 dpf), visualised on a UMAP plot; (C) shows actual mapped subtypes for retinal differentiating and neuron identities.

Acknowledgments
This image is the copyrighted work of the attributed author or publisher, and ZFIN has permission only to display this image to its users. Additional permissions should be obtained from the applicable author or publisher of the image. Full text @ Life Sci Alliance