
Image
|
Figure Caption
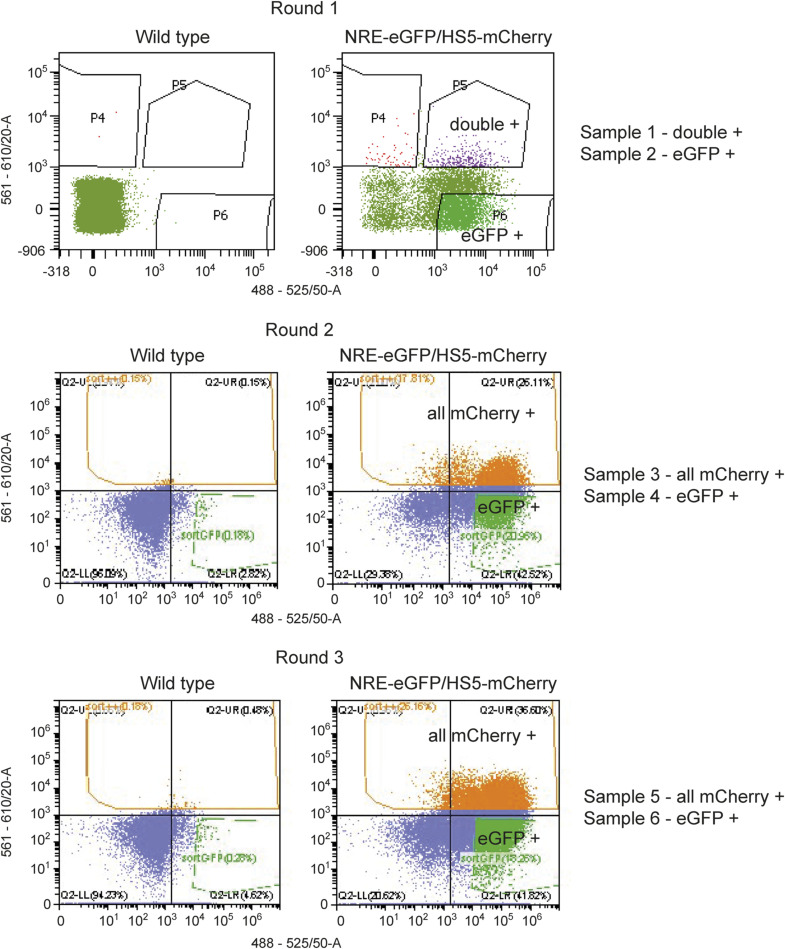
Figure S2. FACS profiles for scRNA-sequencing dataset.
FACS plots showing WT controls (left) and NRE-eGFP/HS5-mCherry samples (right). Samples were sorted for eGFP (x-axis) and mCherry fluorescence (y-axis). In round 1, an eGFP-+ve sample and a double-+ve sample were collected and processed for scRNA-seq. In rounds 2 and 3, an eGFP-+ve sample and a sample of all mCherry-+ve were collected and processed for scRNA-seq.
Acknowledgments
This image is the copyrighted work of the attributed author or publisher, and
ZFIN has permission only to display this image to its users.
Additional permissions should be obtained from the applicable author or publisher of the image.
Full text @ Life Sci Alliance