
- Title
-
Optogenetic manipulation of neuronal and cardiomyocyte functions in zebrafish using microbial rhodopsins and adenylyl cyclases
- Authors
- Hagio, H., Koyama, W., Hosaka, S., Song, A.D., Narantsatsral, J., Matsuda, K., Shimizu, T., Hososhima, S., Tsunoda, S.P., Kandori, H., Hibi, M.
- Source
- Full text @ Elife
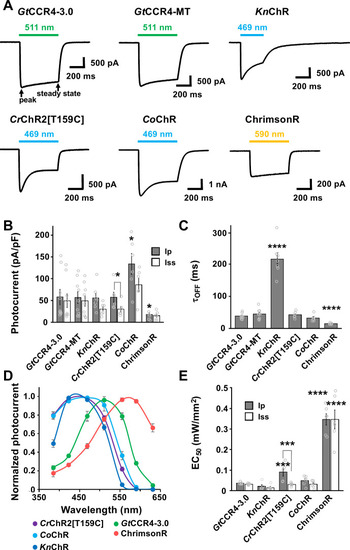
Photocurrent amplitude at − 60 mV was plotted as a function of light power. 511 nm light ( |
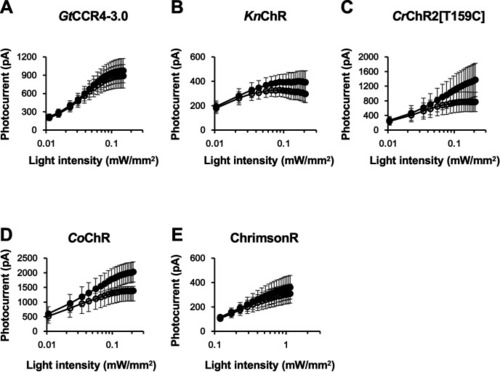
Light power dependency of photocurrent amplitude of Photocurrent amplitude at − 60 mV was plotted as a function of light power. 511 nm light ( |
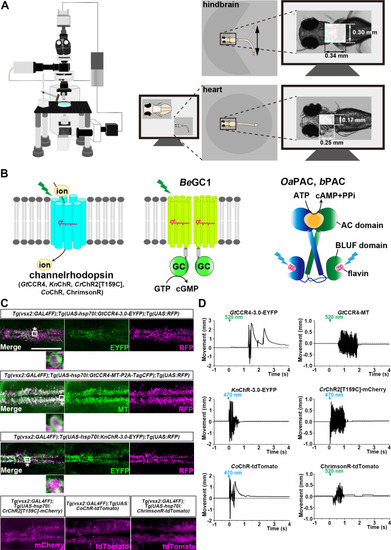
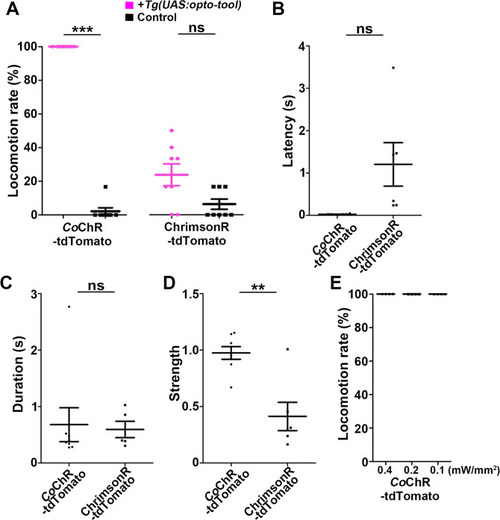
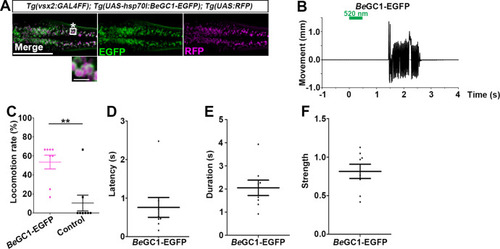
Tail movements in a larva expressing The hindbrain in a 3-dpf |
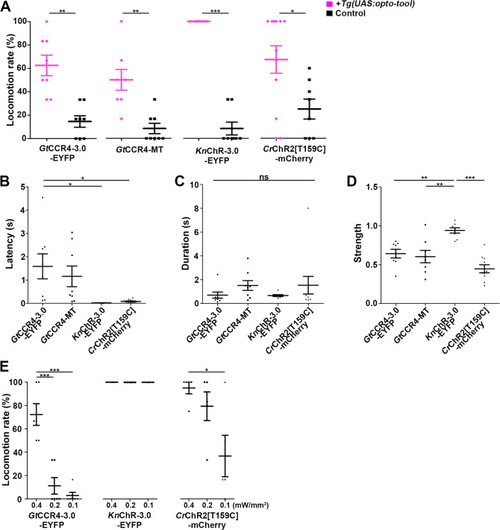
Latency of locomotion in ChR-expressing and non-expressing larvae. The hindbrain of 3-dpf larvae expressing |
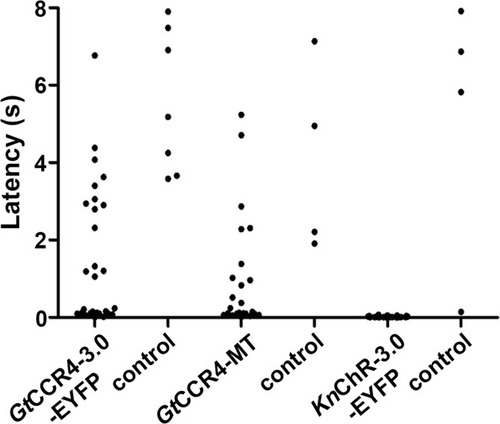
The hindbrain of 3-dpf larvae expressing |
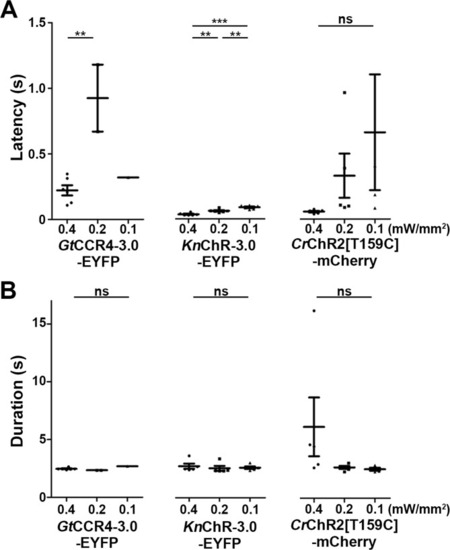
Latency ( |
( |
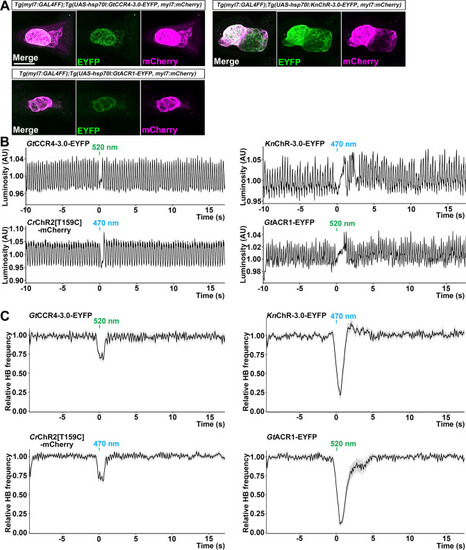
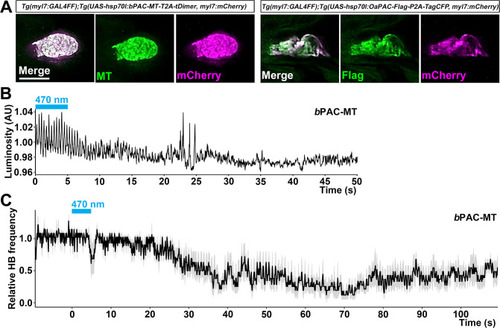
The heart area of |
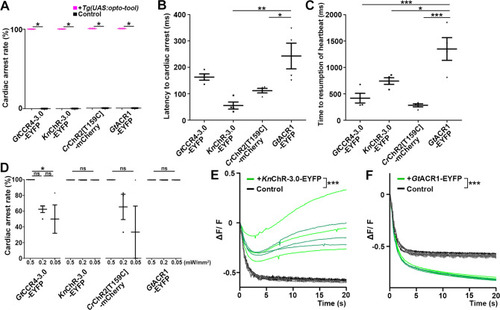
Latency to cardiac arrest ( |
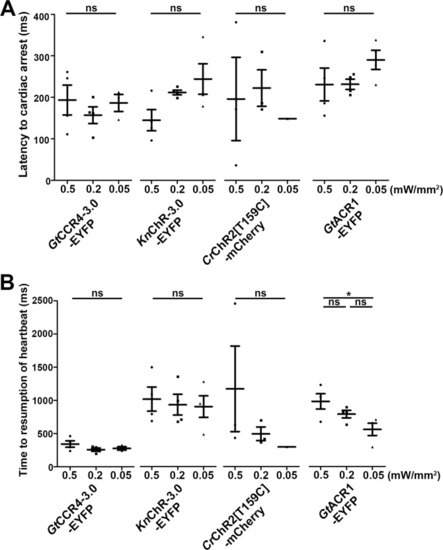
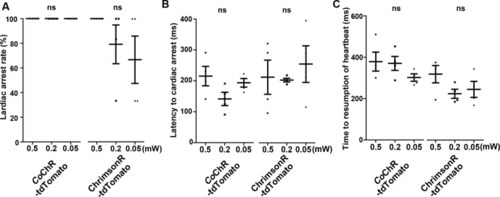
Cardiac arrest induced with channelrhodopsins (ChRs) by light of various intensities. Latency to cardiac arrest ( |
( |
The hindbrain in a 3-dpf |
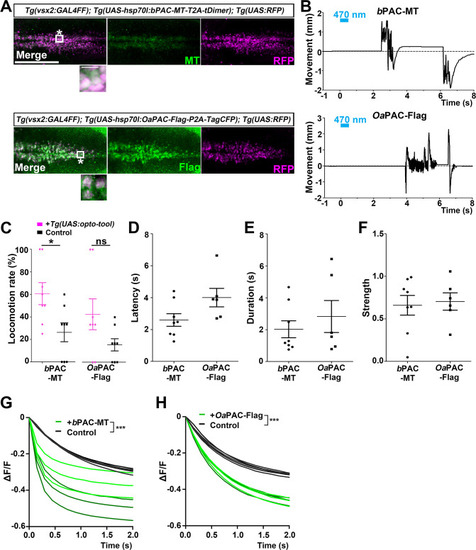
The hindbrain of 3-dpf larvae expressing |
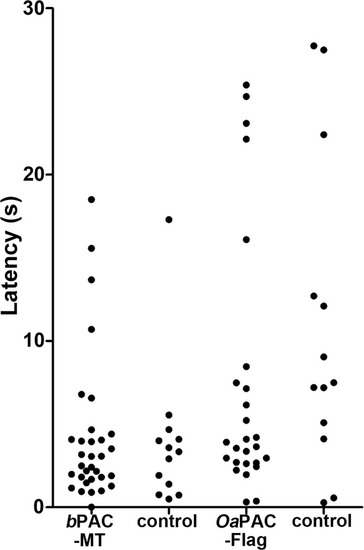
Latency of locomotion in PAC-expressing and non-expressing larvae. The hindbrain of 3-dpf larvae expressing |
( |