
FIGURE
Figure 1—figure supplement 1—source data 1.
- ID
- ZDB-FIG-230818-28
- Publication
- Hagio et al., 2023 - Optogenetic manipulation of neuronal and cardiomyocyte functions in zebrafish using microbial rhodopsins and adenylyl cyclases
- Other Figures
-
- Figure 1—figure supplement 1—source data 1.
- Figure 1—figure supplement 1—source data 1.
- Figure 2—video 1.
- Figure 3—figure supplement 1—source data 1.
- Figure 3—figure supplement 1—source data 1.
- Figure 3—figure supplement 2—source data 1.
- Figure 3—figure supplement 3—source data 1.
- Figure 4—video 1.
- Figure 5—figure supplement 1—source data 1.
- Figure 5—figure supplement 1—source data 1.
- Figure 5—figure supplement 2—source data 1.
- Figure 6—video 1.
- Figure 7—figure supplement 1—source data 1.
- Figure 7—figure supplement 1—source data 1.
- Figure 7—figure supplement 2—source data 1.
- All Figure Page
- Back to All Figure Page
Figure 1—figure supplement 1—source data 1.
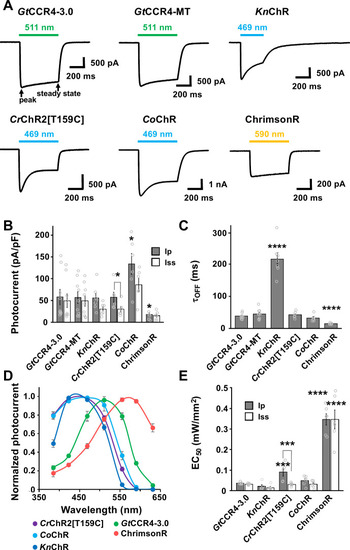
Photocurrent amplitude at − 60 mV was plotted as a function of light power. 511 nm light ( |
Expression Data
Expression Detail
Antibody Labeling
Phenotype Data
Phenotype Detail
Acknowledgments
This image is the copyrighted work of the attributed author or publisher, and
ZFIN has permission only to display this image to its users.
Additional permissions should be obtained from the applicable author or publisher of the image.
Full text @ Elife